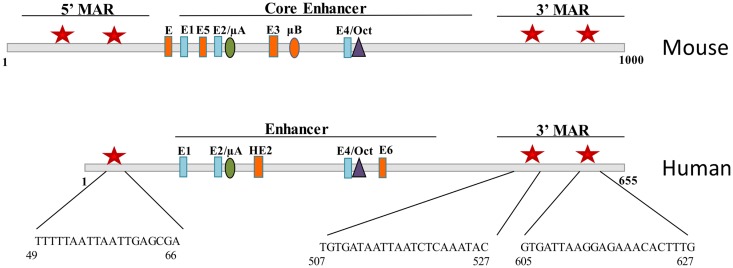
Figure 3.
Bright binds to sequences flanking the mouse and human IgH enhancer. Schematic diagrams of fragments including the Eμ core enhancer show binding site for E proteins, Ets proteins (μA, μB, HE2), and Oct transcription factors. Matrix association regions (MARs) identified by MAR-binding assays are indicated by red stars on either side of the core (1). Orange enhancer elements denote those regions that are not conserved between species.

