Figure 5.
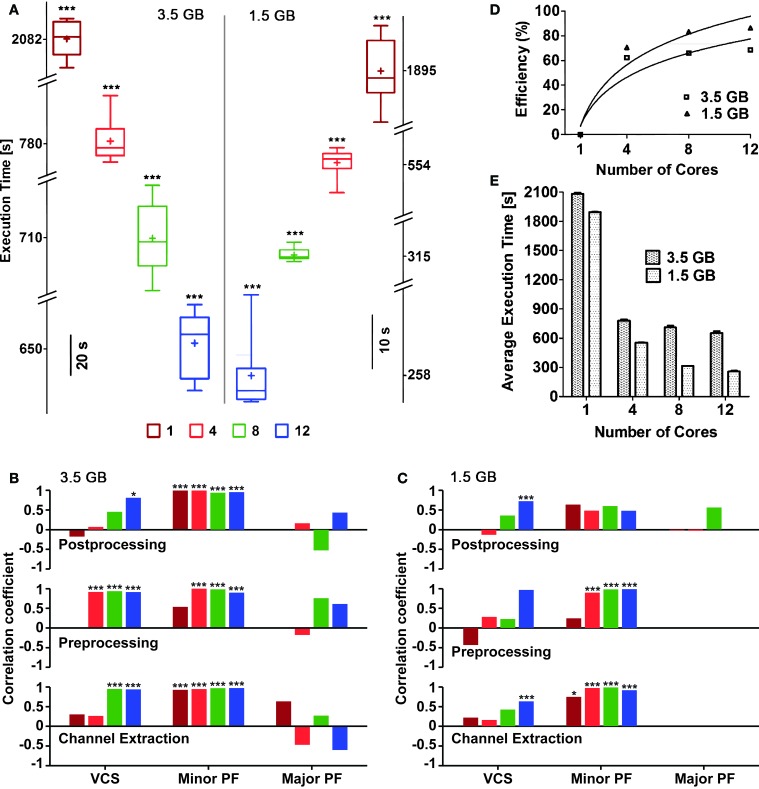
Execution times and efficiency, for an increasing numbers of cores reserved. Box plots (A) with box height showing 25–75% of the sample values were used to represent maximum and minimum (whiskers), median (“−”) and mean (“+”) execution times, respectively, which were all significantly different (p < 0.05) based on the number of cores used. The vertical line in the middle separates the data representation corresponding to distinct file sizes (3.5 vs. 1.5 GB). Pearson's liner correlation coefficients (B,C) show that the execution times of individual sub-processes are correlated to, certain computationally intensive operations performed by the operating system such as, minor page faults (Minor PF), and voluntary context-switching (VCS) (***p < 0.0001; *p < 0.05) in case of large file size (B). Though major page faults (Major PF) were noticed while analyzing the large file, they had either negative or no correlation to the execution times. The execution times of the first two sub-processes for the small file were mainly correlated to Minor PF (***p < 0.0001; *p < 0.01) (C). Overall, negligible amount of Major PF occurred during the execution of the small file and only when large number of cores was used, correlation between execution times and VCS were noticed. The bars in (B,C) are plotted using the same color code of (A). The efficiency of parallelization was also quantified (D) as referred to the slowest execution time when a single core was used: continuous lines are best-fit logarithmic plots, whose mean squares were 0.8807 and 0.9306 for 3.5 and 1.5 GB file sizes, respectively. The mean execution times (E) for both file sizes also show the reduction of the execution time, for an increasing number of cores available.

