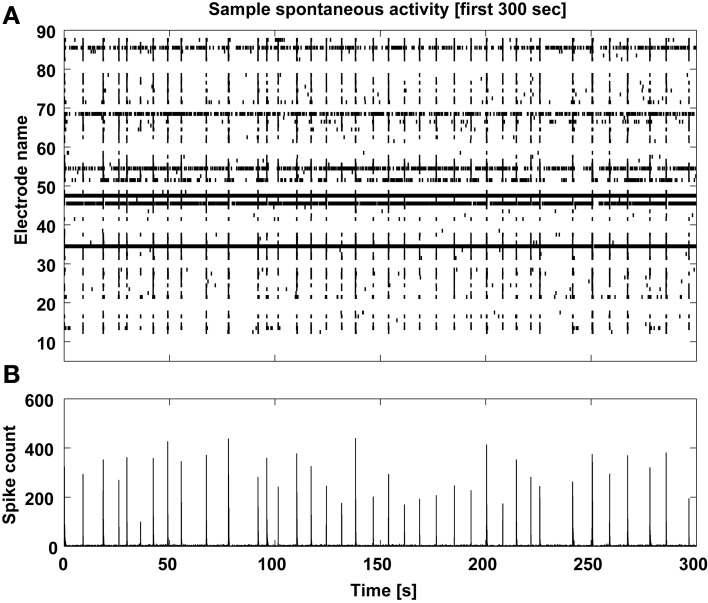
Figure 8.
Sample spontaneous activity display. The multiunit spontaneous activity is displayed as raster-plot (A) across the detecting microelectrodes for the first 5 min of each data file, and its corresponding spike count is computed (B) to reveal the MEA-wise stereotypical episodic synchronization of neuronal activity.

