Figure 2.

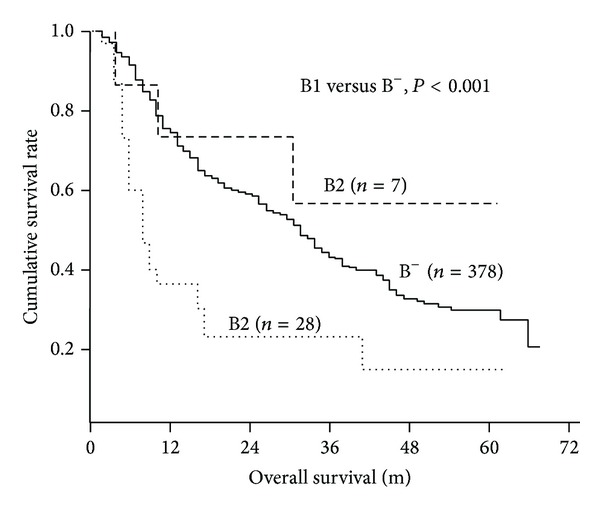
Kaplan-Meier curves of overall survival of the 35 patients with bile duct invasion according to different type of bile duct invasion. B1, central type; B2, peripheral type.

Kaplan-Meier curves of overall survival of the 35 patients with bile duct invasion according to different type of bile duct invasion. B1, central type; B2, peripheral type.