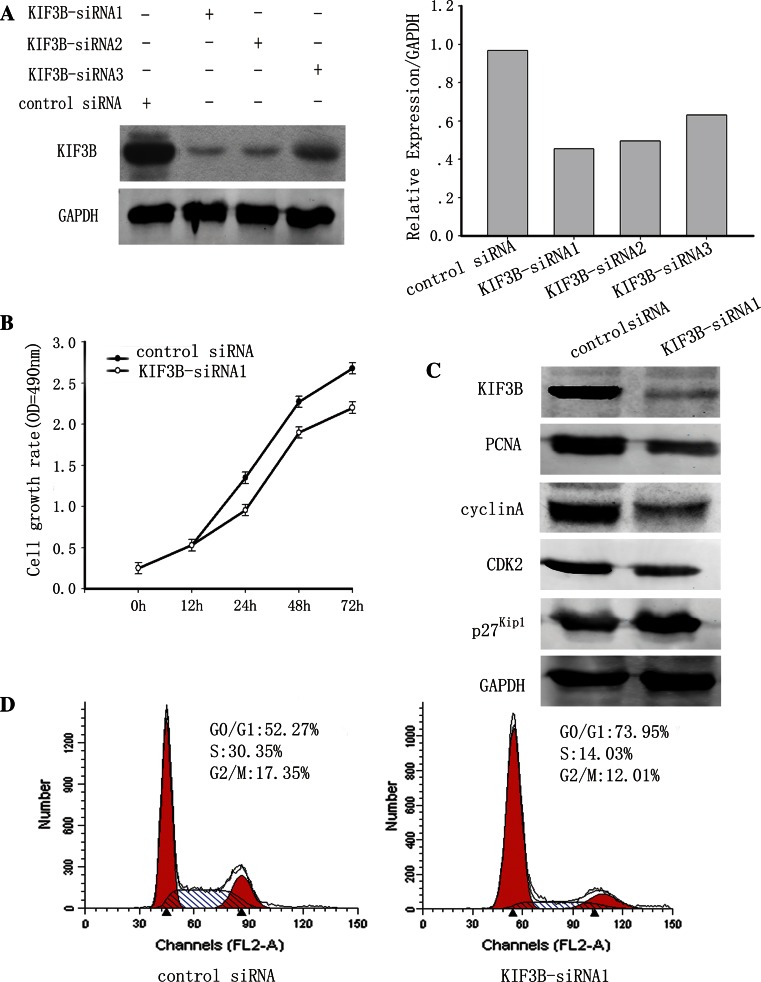
Fig. 6.
Knockdown of KIF3B inhibited the HCC cells proliferation and M-phase entry. a KIF3B protein expression detected by Western blot 72 h after siRNA transfection of HepG2 cells. Western blotting showed that KIF3B-siRNA1 had the highest knockout efficiency of the three siRNAs tested. Therefore, KIF3B-siRNA1 was used for all the subsequent experiments. The bar chart below demonstrates the ratio of KIF3B protein to GAPDH by densitometry. The data are mean ± SEM (P < 0.01 compared with the control). b Cell proliferation was measured using the CCK-8 assay. Cell Counting Kit-8 reagents were added to the medium and incubated for an additional 2 h. Absorbance was measured to examine the siRNA-treated HepG2 cells. Data show mean ± SD of triplicates from one experiment representative of three experiments performed. *P < 0.05 versus control. c Western blot analysis of PCNA, cyclins A, CDK2 and p27Kip1 in KIF3B knockdown HepG2 cells. d 72-h post-transfection, cells transfected, as described above, were stained with PI for DNA content analysis by FACS. Details of the experiments are given in “Materials and methods”

