
Fig. 2.
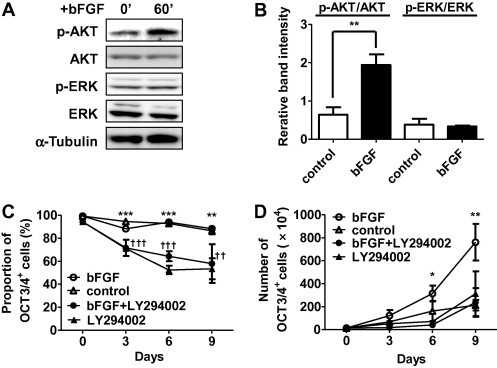
bFGF-PI3K-AKT pathway supports self-renewal of CM ESCs. (A) Western blot analysis showing the activation of AKT by bFGF in CM ESCs. CM40 cells were starved of bFGF and KSR overnight, and then stimulated with 5 ng/ml of bFGF for the indicated durations. AKT, ERK1/2 and α-Tubulin are shown as loading controls. The relative band intensities of p-AKT/AKT and p-ERK/ERK are shown in (B). Band intensities were measured by ImageJ software. Data are shown as the mean ± SD. The Student’s t-test was used to test inter-group differences. ∗∗P < 0.01. (C) Inhibition of self-renewal by LY294002. CM ESCs (CM40; 1.4 × 10⁵) were seeded on MMC-treated MEFs and cultured in medium containing bFGF (open circle), control medium (open triangle), bFGF+LY294002 (closed circle) or LY294002 (closed triangle). The percentage of OCT3/4+ cells was then determined by FCM at the indicated day as shown in (C). The number of live cells was counted by trypan blue exclusion. Growth curves were generated by multiplying the number of live cells by the percentage of OCT3/4+ cells and passage ratio together as shown in (D). Data are shown as the mean ± SD. bFGF, n = 4; control, n = 4; bFGF+LY294002, n = 3; LY294002, n = 3; ∗P < 0.05, ∗∗P < 0.01, and ∗∗∗P < 0.005, bFGF vs. control; ††P < 0.01 and †††P < 0.005, bFGF+LY294002 or LY294002 vs. control.