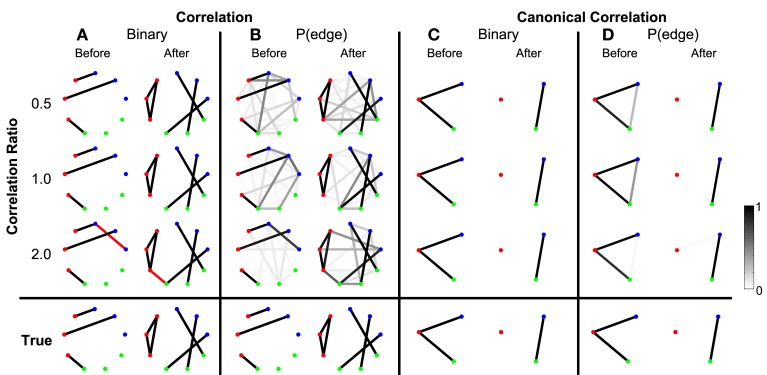
Figure 5.
True networks can be detected in the presence of background correlations. Correlation and canonical correlation networks are shown before and after task onset, for simulations with varying correlation ratio. (A–D) as in Figure 3, shown in the rows for three different levels of the ratio of trial correlation variance to constant correlation variance: 0.5, 1.0, and 2.0. All simulations have a fixed SNR of 0.11. False positives are indicated in (A,C) by red edges. True positives are displayed in black.

