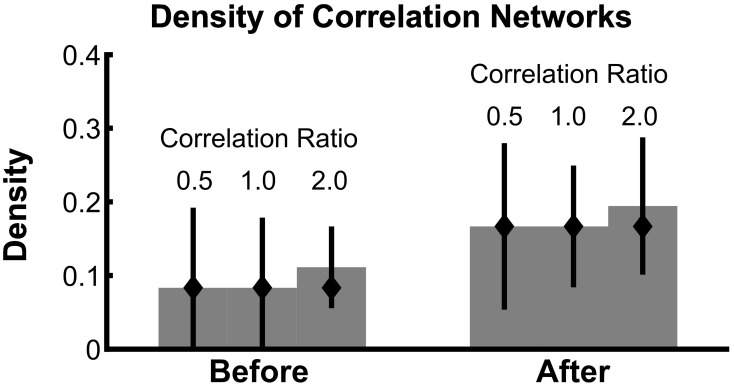
Figure 6.
Confidence intervals on network density include the true density, even in the presence of baseline correlations. The density of bootstrapped correlation networks is plotted before and after task onset, for simulations with three different levels of the correlation ratio: 0.5, 1.0, and 2.0. Bars, confidence intervals, and true density as in Figure 4.

