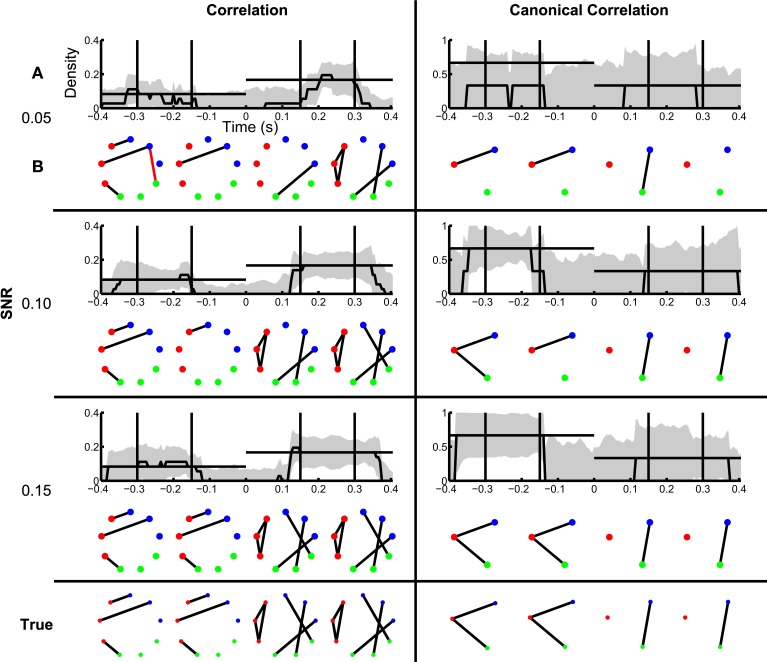
Figure 7.
Dynamic changes in network structure are better resolved at higher SNRs. Correlation and canonical correlation networks are shown as a function of time with respect to task onset, for simulations with varying SNR. (A) Density of observed networks as a function of time (black), with 95% bootstrapped confidence intervals (shaded gray). The timing of four example binary networks (B) is indicated by black vertical lines, and the true densities are indicated by horizontal black lines. In (B), network edges that exist in the true network are shown in black and false positive edges are shown in red. In all networks, nodes are color-coded according to region. (A,B) are shown for correlation (left) and canonical correlation (right) networks, for three different levels of SNR: 0.05 (top), 0.10 (middle), and 0.15 (bottom). True networks are shown in the bottom row.

