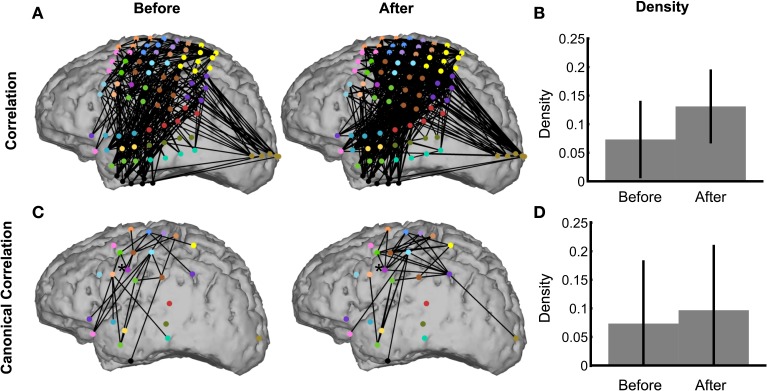
Figure 9.
The network inference procedure facilitates interpretations of real ECoG data. Binary correlation (A) and canonical correlation (C) networks were inferred from speech data in the intervals 500 ms before (left) and 500 ms after (right) speech onset. The corresponding densities are significantly nonzero for both correlation networks (B), but not for the canonical correlation networks (D). The node colors in (A) represent for each electrode the corresponding ROI, shown in (C). Node locations in (C) are the average locations of the electrodes corresponding to the ROI. In (C), the node indicated by an asterisk (*) is the ventral primary motor cortex ROI, which is discussed in the text (Methods section ECoG Data).

