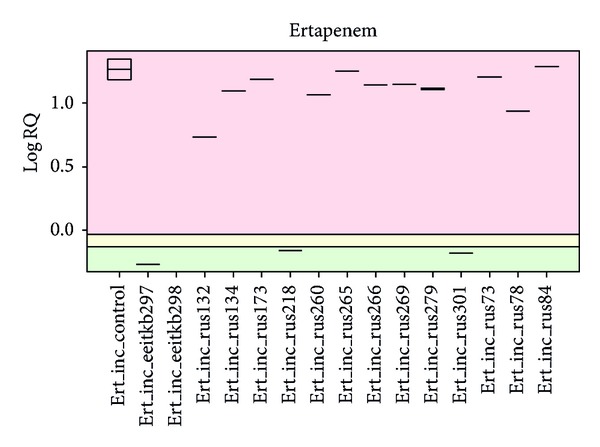
Figure 3.

Evaluation of the MALDI-TOF MS spectra of 16 different Klebsiella pneumoniae strains using the new software prototype. Differences in the hydrolysis rates of the different strains can easily be detected: green area: no hydrolysis; yellow area: intermediate hydrolysis; red area: hydrolysis.
