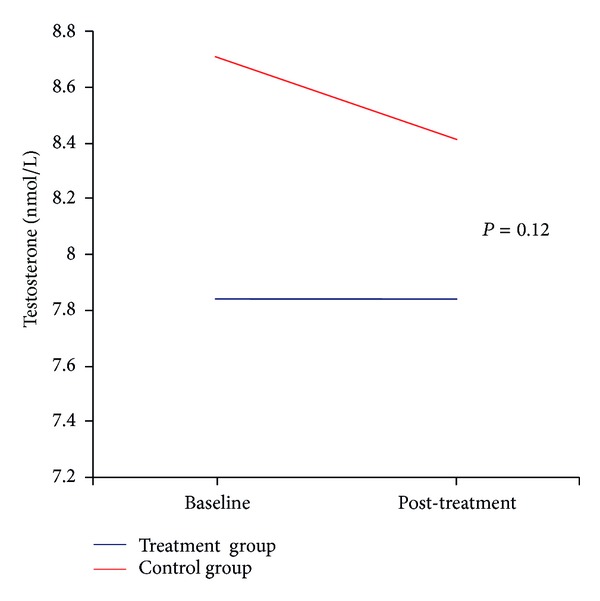
Figure 1.

Changes in Testosterone levels at baseline and after treatment. Changes in the average Testosterone levels (nmol/L) before (baseline) and after (post-treatment) magnesium sulfate administration (blue line) and placebo (red line). The difference in total Testosterone levels between the 2 groups touched the statistical significance (P = 0.12).
