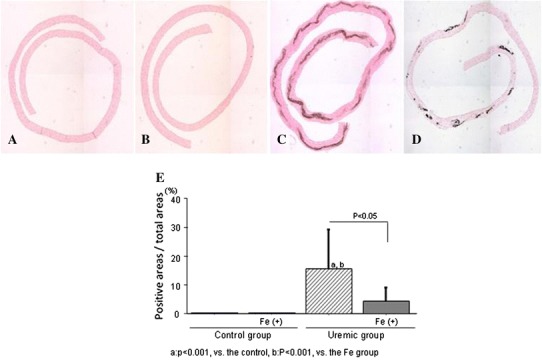
Fig. 2.

Monocyte adhesion to the endothelium and arterial calcification. Representative von Kossa staining on day 56 in the control group (a), the Fe group (b), the uremic group (c), and the uremic + Fe group (d). e The area of calcification in the uremic + Fe group was significantly suppressed compared to that in the uremic group (p < 0.05). ap < 0.001 versus the control group, bp < 0.001 versus the Fe group. Data are expressed as mean ± SD in each group
