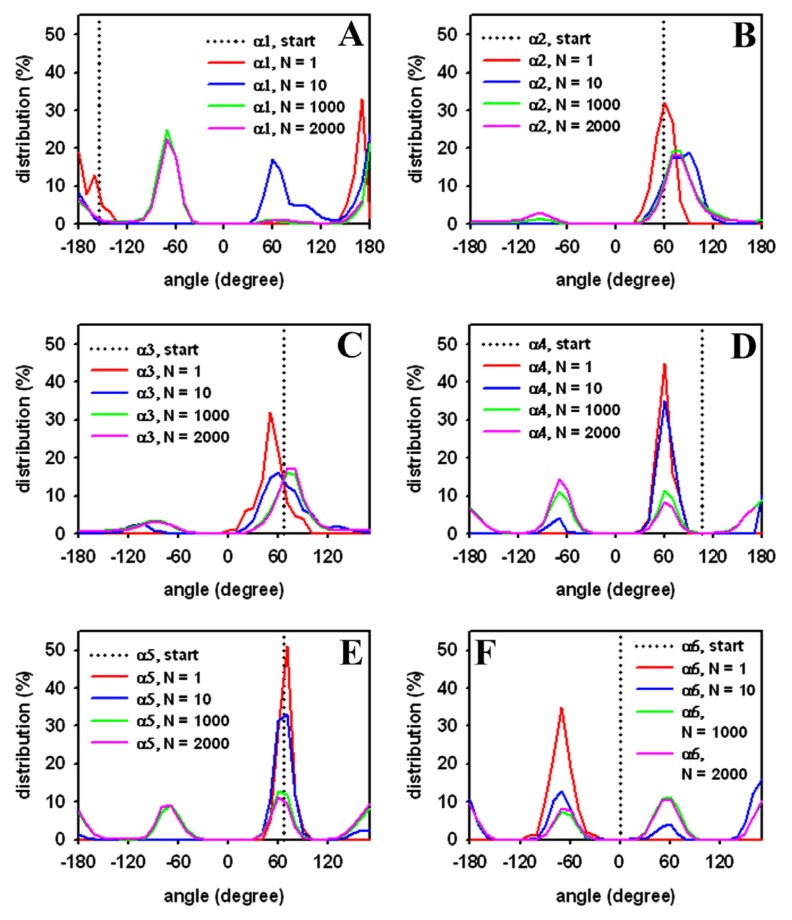
Figure 4.
Distribution of DPPC head group dihedral angles from a single-molecule simulation. Head group torsions were defined as in Vanderkooi et al. [84] with the starting value defined by the initial conformation (dotted lines, “start”; compare Figure 2A). The percentage of occupation was calculated as function of torsion angle (in degree) after 1000 (“N = 1”, red line), 10,000 (“N = 10”, blue line), one million (“N = 1000”, green line), and two million (“N = 2000”, pink line) MC steps, respectively. The dihedral angles are defined as (A) torsions around atom 6 and 7 (α1); (B) atom 5 and 6 (α2); (C) atom 4 and 5 (α3); (D) atom 3 and 4 (α4); (E) atom 2 and 3 (α5); and (F) atom 1 and 2 (α6), respectively (compare Figure 2 for atom numbering in the DPPC molecule).

