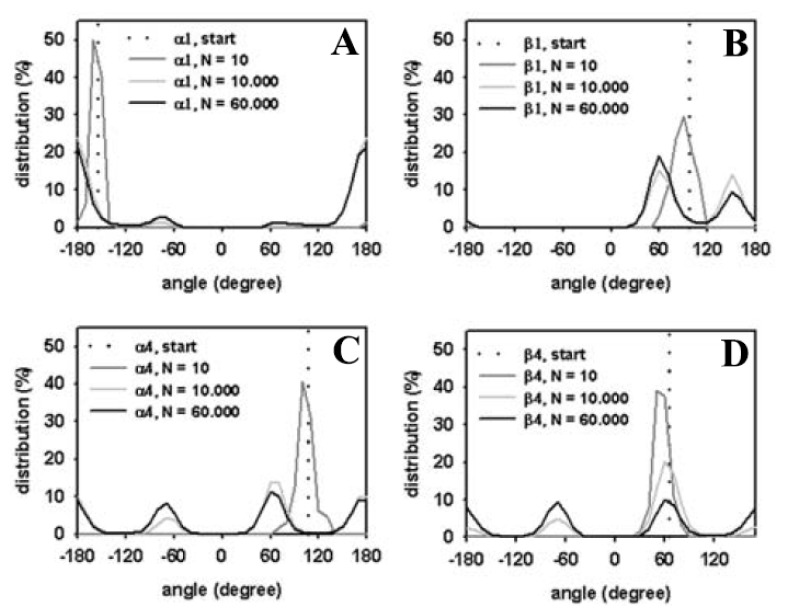
Figure 6.
Head group torsions of DPPC in the membrane. Head group dihedral angles were defined as in Vanderkooi et al. [84], and as given in the legend to Figure 5. The starting value is defined by the initial conformation (dotted lines, “start”; compare Figure 2A). The percentage of occupation was calculated as function of torsion angle (in degree) after 10 (“N = 10”, dark grey line), 10,000 (“N = 10,000”, light grey line), 60,000 (“N = 60,000”, black line) MC steps, respectively. (A) shows the torsion around the bond connecting atoms 6 and 7 (α1); (B) around the bond connecting atoms 8 and 9 (β1) (C) around the bond connecting atoms 3 and 4 (α4) and (D) is the torsion angle distribution around the bond connecting atoms 11 and 12 (β4).

