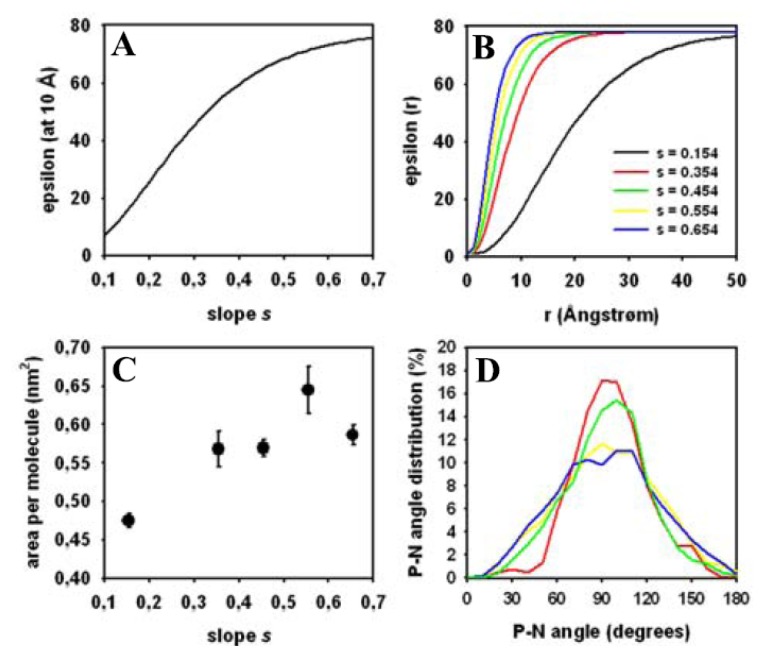
Figure 8.
Impact of electrostatic interactions on membrane structure. (A) the distance-dependent dielectric constant is plotted as function of the slope, s, as defined in Equation (7) for a fixed distance from a charged group of 10 Å; (B) the distance-dependent dielectric constant is plotted as function of the distance from a charged group for various slope values of s = 0.154 (black line), s = 0.354 (red line), s = 0.454 (green line), s = 0.554 (yellow line), and s = 0.654 (blue line), respectively; (C) the area per lipid was calculated from the least 40,000 steps of separate MC runs performed with differing slope values of the dielectric constant. The mean ± SD is plotted as function of slope, s; (D) the head group orientation was inferred from the angle between the P–N vector and the bilayer normal and plotted for the separate MC runs. Increasing the slope, s, of the dielectric constant resulted in a broadening of the angle distribution (color coding is as for panel B). See text for more details.

