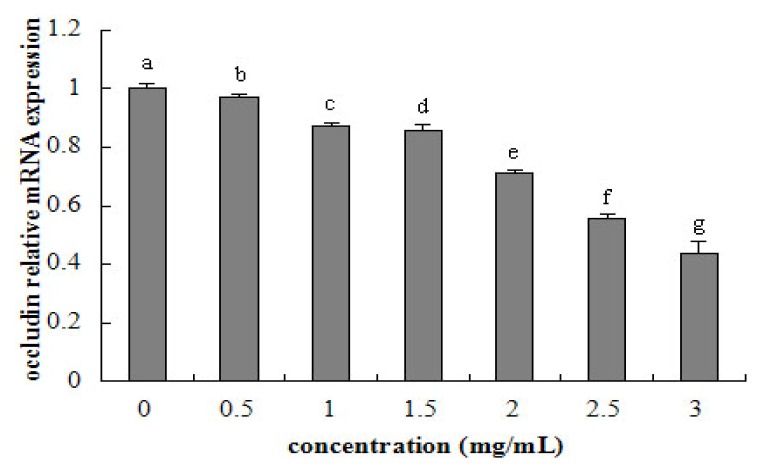
Figure 6.
Occludin relative mRNA expression of IPEC-J2 cells after 24 h incubation of β-conglycinin. Each bar represents four independent experiments performed in triplicates ± SD. a, b, c, d, e, f, g each represent two groups for different concentrations which are statistically different from each other.

