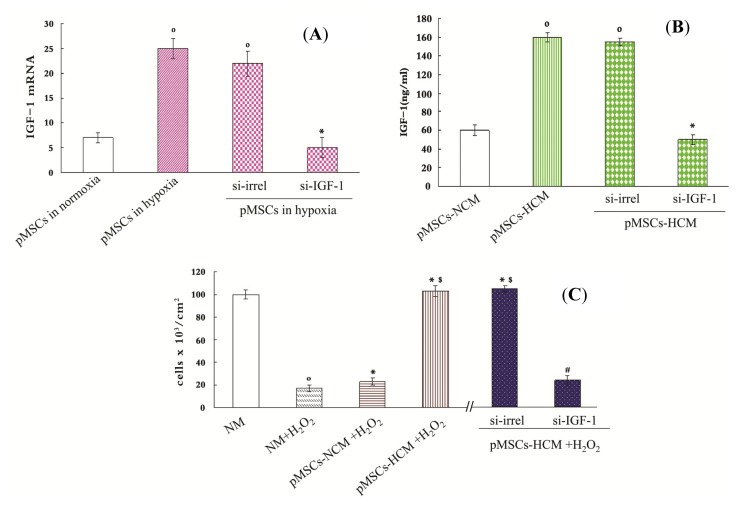
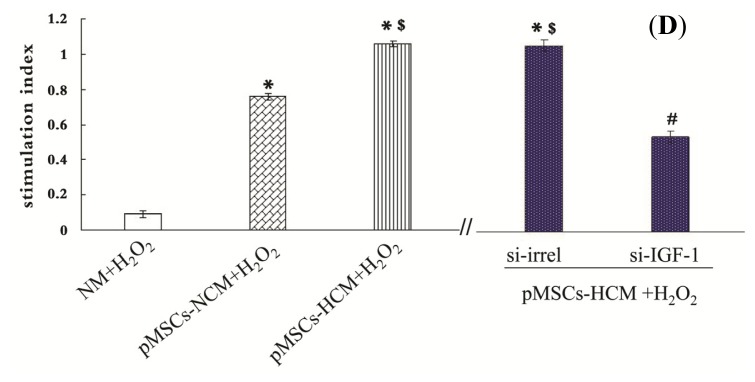
Figure 4.
The pMSCs hypoxia culture medium is more conducive to promote H2O2-treated-caco2 cells proliferation via IGF-1. (A and B) Silence IGF-1 in pMSCs by siRNA: (A) After two-day culture, pMSCs in hypoxia had much more IGF-1 mRNA than that in normoxia, and it is the same with pMSCs in hypoxia transfected with si-irrel. When cultured in hypoxia, si-IGF-1-pMSCs had much less IGF-1 mRNA than si-irrel-pMSCs. º p < 0.05 versus pMSCs in normoxia; * p < 0.05 versus si-irrel-pMSCs in hypoxia (n = 6); (B) IGF-1 protein level in pMSCs-HCM and siirrel-pMSCs-HCM were much higher than that in pMSCs-NCM after four-day culture. IGF1 protein level in si-IGF-1-pMSCs-HCM obviously decreased compared with si-irrelpMSCs-HCM; º p < 0.05 versus pMSCs-NCM; * p < 0.05 versus si-irrel-pMSCs-HCM (n = 6); (C) Trypan blue staining is used to detect viable cell number. After H2O2-treated-caco2 cells were cultured in NM, pMSCs-NCM, pMSCs-HCM, si-irrel-pMSCs-HCM or si-IGF-1pMSCs-HCM for five days, viable cell number were assessed. º p < 0.05 versus NM; * p < 0.05 versus NM + H2O2; $ p < 0.05 versus pMSCs-NCM + H2O2; # p < 0.05 versus si-irrel-pMSCs-HCM + H2O2 (n = 6); and (D) MTT is used to detect cellular metabolic activity. After H2O2-treated caco2 cells were cultured in NM, pMSCs-NCM, pMSCs-HCM, si-irrel-pMSCs-HCM or si-IGF-1pMSCs-HCM for five days, cellular metabolic activity were assessed by MTT. * p < 0.05 versus NM + H2O2; $ p < 0.05 versus pMSCs-NCM + H2O2; # p < 0.05 versus si-irrel-pMSCsHCM + H2O2 (n = 6).


