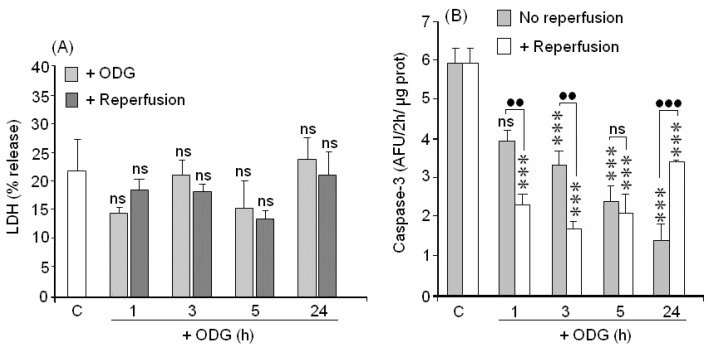
Figure 4.
Evaluation of cellular death. (A) Necrosis was evaluated by LDH release; (B) Apoptosis was evaluated by caspase-3 activity. Results are means ± SEM of three experiments with cells from different cultures, each one was performed in triplicate with different batches of cells (9 measurements/condition). ns = no significant (vs. control); (●●) = p < 0.01 (vs. ischemia with or without reperfusion); (***) (vs. control) or (●●●) = p < 0.005 (vs. ischemia with or without reperfusion).

