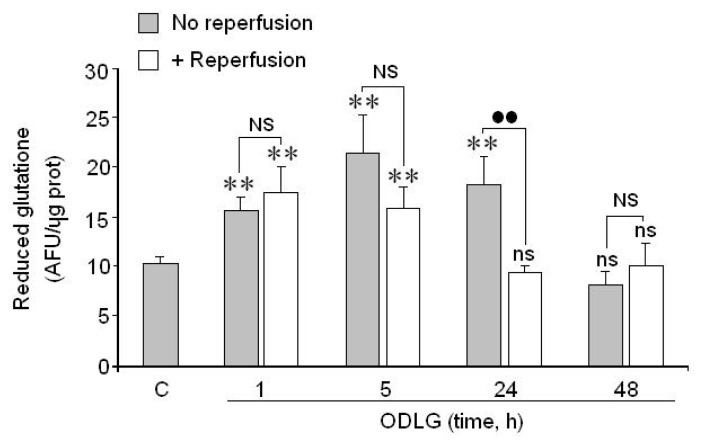
Figure 6.
Action of 1, 3, 5, 24 and 48 h of ODLG treatment on reduced glutathione levels, before and after 24 h of reperfusion. Results are means ± SEM of two experiments with cells from different cultures, each one performed in triplicate (6 measurements/condition). ns = no significant (vs. control); NS = no significant (vs. ischemia with or without reperfusion; (**) (vs.control) or (●●) (vs. ischemia with or without reperfusion) = p < 0.01.

