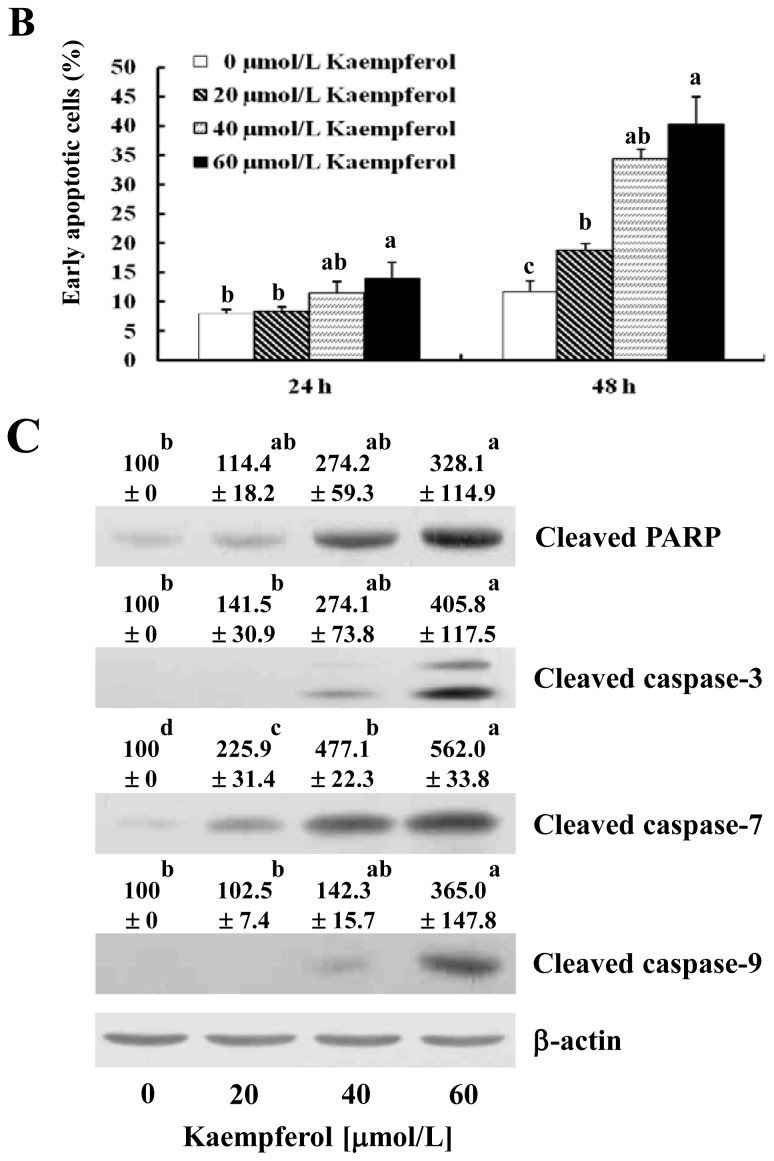
Figure 2.
Effect of kaempferol on apoptosis of HT-29 cells. (A) Cells were plated in 4-well chamber slides and treated with various concentrations of kaempferol for 48 h. Cells were fixed and stained with Hoechst 33258. Arrows indicate apoptotic cells; (B) Cells were plated in 24-well plates and treated with various concentrations of kaempferol for 24 or 48 h. Cells were trypsinized, loaded with Annexin V and 7-amino-actinomycin D (7-AAD), and analyzed by flow cytometry. The percentages of early apoptotic cells (Annexin V+/7-AAD− cells) were calculated. Each bar represents the mean ± SEM (n = 6); (C) Cells were plated in 100-mm dish and treated with various concentrations of kaempferol for 48 h. Total cell lysates were analyzed via Western blotting with antibodies against the indicated antibodies. The relative abundance of each band was quantified and the control levels (0 μmol/L kaempferol) were set at 100%. The adjusted mean ± SEM (n = 3) of each band is shown above each blot. Means without the same letter (a, b, c or d) are significantly different (p < 0.05).


