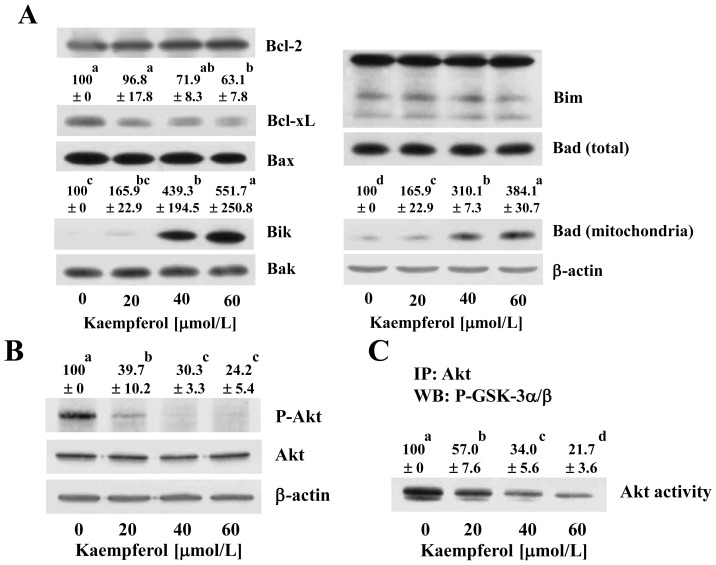
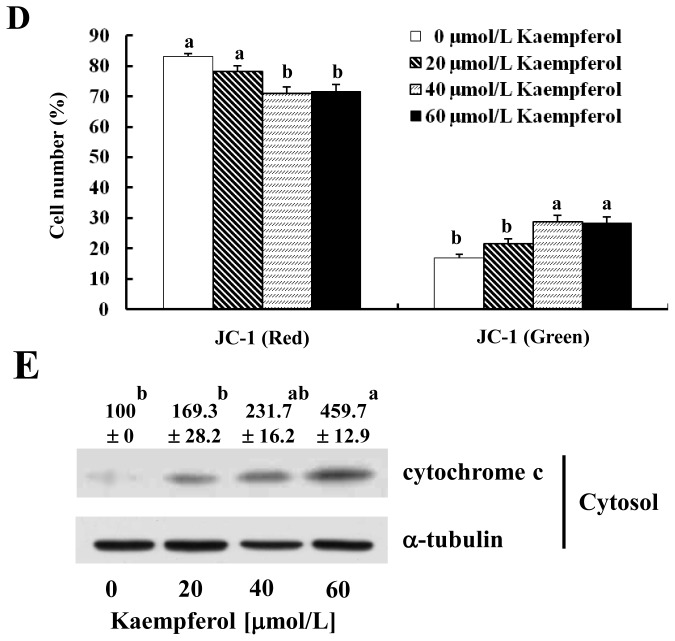
Figure 4.
Kaempferol induces changes in the levels and localization of Bcl-2 family proteins. Cells were treated with various concentrations of kaempferol for 48 h. (A,B,E) Total cell lysates and subcellular fractions were prepared and analyzed via Western blotting with antibodies against the indicated antibodies; (C) Total cell lysates were incubated with immobilized Akt antibody, and the immunoprecipitated proteins were incubated with GSK-3α/β (a substrate) and ATP. Each sample was analyzed via Western blotting with anti-P-GSK-3α/β antibody; (A,B,C,E) The relative abundance of each band was quantified and the control levels (0 μmol/L kaempferol) were set at 100%. The adjusted mean ± SEM (n = 3) of each band is shown above each blot; (D) Cells were trypsinized, loaded with JC-1 and analyzed by flow cytometry. Each bar represents the mean ± SEM (n = 6). Means without the same letter (a, b, c or d) are significantly different (p < 0.05).


