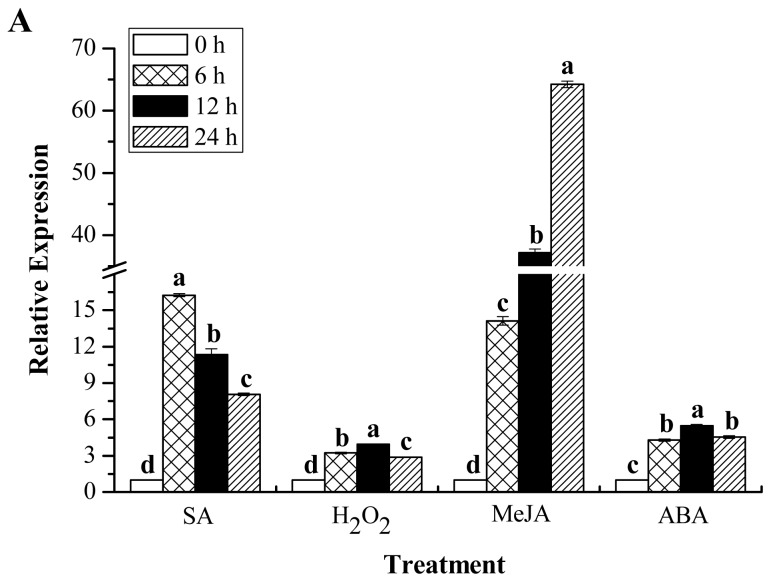
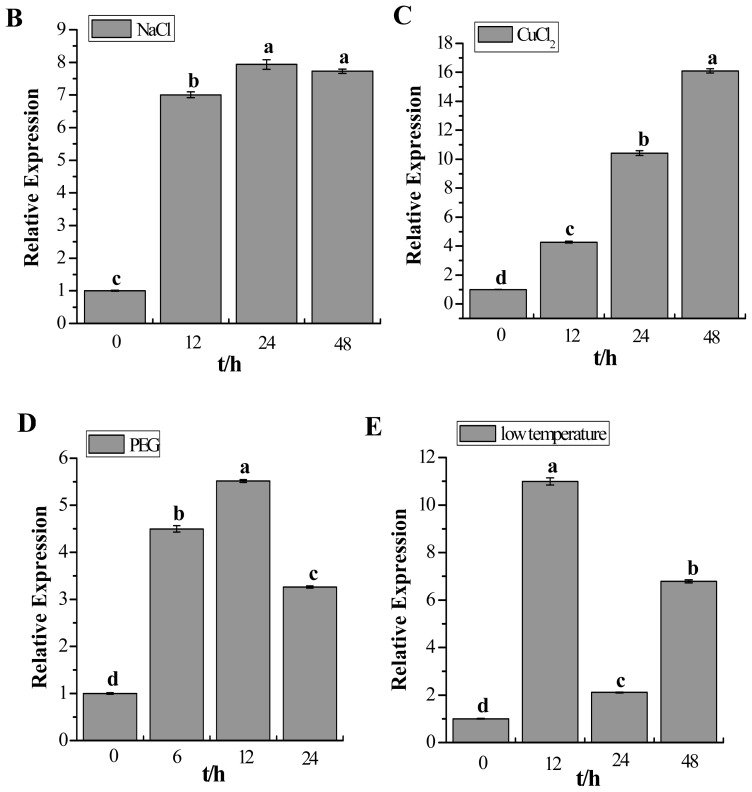
Figure 10.
RT-qPCR analysis of the ScChi expression patterns in Yacheng05–179 plantlets under various abiotic stresses. Data were normalized to the GAPDH expression level. (A) The relative expression of ScChi under the stresses of 5 mM SA, 10 mM H2O2, 25 μM MeJA and 100 μM ABA; (B–E) the relative expression of ScChi under the stresses of 250 mM NaCl, 100 μM CuCl2, 25% PEG and 4 °C low temperature, respectively. All data points are the means ± SE (n = 3). Different lowercase letters indicate a significant difference, as determined by the least-significant difference test (p-value < 0.05). SA, salicylic acid; H2O2, hydrogen peroxide; MeJA, methyl jasmonate; ABA, abscisic acid; NaCl, sodium chloride; CuCl2, copper chloride; PEG, polyethylene glycol.


