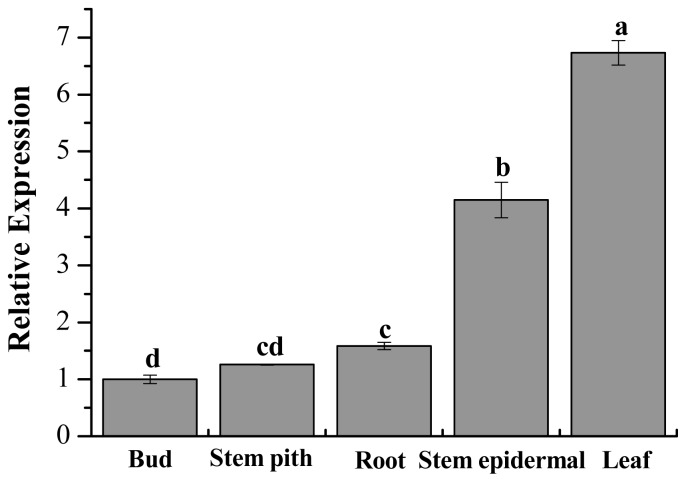
Figure 8.
Tissue-specific expression analysis of the ScChi in different tissues of sugarcane cultivar Yacheng05–179. Data are normalized to the GAPDH expression level. All data points are the means ± SE (n = 3). Different lowercase letters indicate a significant difference, as determined by the least-significant difference test (p-value < 0.05).

