Figure 1.

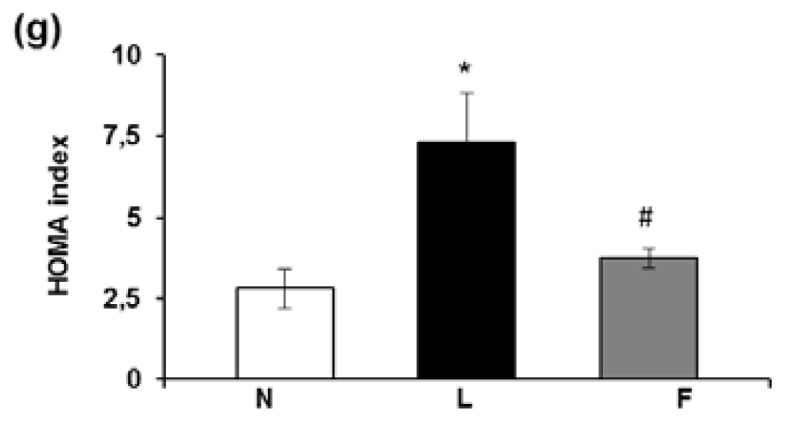
Serum adipokines. (a,b) Serum leptin and adiponectin levels; (c,d) Serum TNF-α and MCP1 levels and (e,f) Serum glucose and insulin levels; (g) HOMA index. The data represent the means ± SE for 8 rats in each experimental group. * p < 0.05 compared with N rats; and # p < 0.05 compared with L rats.

