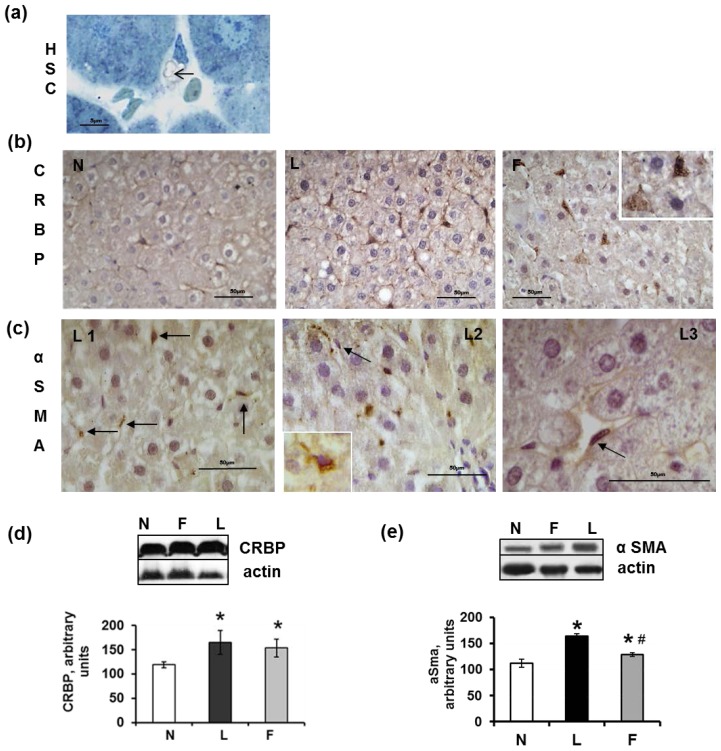
Figure 6.
Hepatic stellate cells (HSC) in sections from rats fed a control diet (N), high-lard diet (L) or high-fish oil diet (F). (a) Semi-thin section of an N liver that shows the cytoplasm of an HSC that is filled with lipid droplets (arrow); (b) N: CRBP-immunoreactive cells (HSCs) appeared to form a network around the N hepatocytes. L: CRBP-immunoreactive cells appeared to be more numerous than those of the N rats. F: strong positivity for CRBP in HSCs. The inset shows a higher magnification of CRBP-immunoreactive HSCs that are present in the Disse space; (c) L1 and L2: The arrows indicate the positivity for α-SMA in elongated cells of the walls of blood vessels. L3: A higher magnification of an α-SMA-positive HSC; (d) Representative Western blot analysis of CRBP and corresponding densitometric analyses on the relative protein levels in the N, L and F rat livers. The data represent the means ± SE. * p < 0.05 vs. N rats; (e) Representative Western blot analysis of α-SMA and corresponding densitometric analyses on the relative protein levels of the N, L and F rat livers. The data represent the means ± SE. * p < 0.05 vs. N rats. # p < 0.05 compared with L rats.

