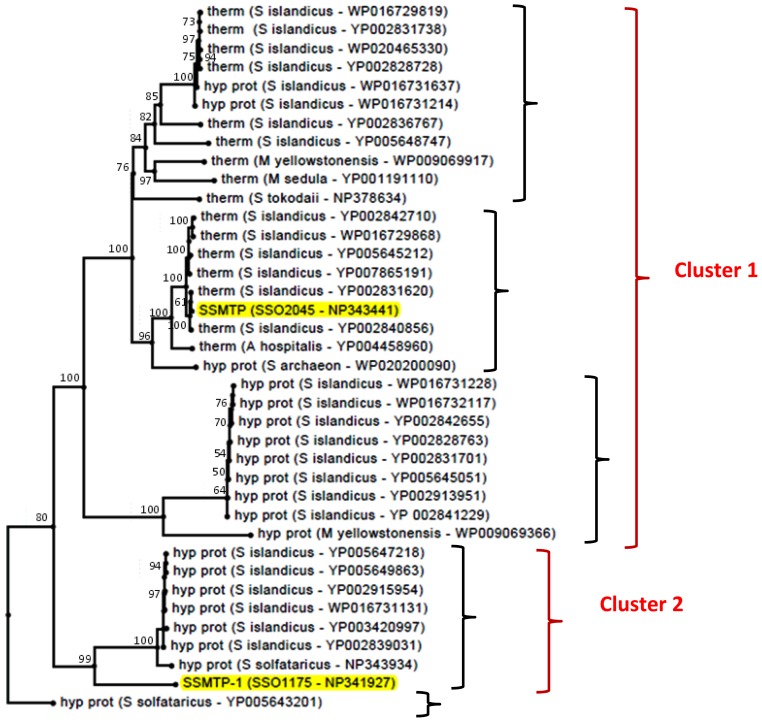
Figure 4.
Phylogenetic analysis of SsMTP-1 and SsMTP in the archaeal kingdom (highlighted). The cladogram includes the homologous sequences retrieved from all the archaeal organisms. The numbers at nodes represent the confidence limits computed by the bootstrap procedure (100 replicates). Black curly brackets indicate the five thermopsin-like protein families defined by the phylogenetic tree. Red curly brackets indicate the two clusters, including SsMTP (Cluster 1) or SsMTP-1 (Cluster 2).

