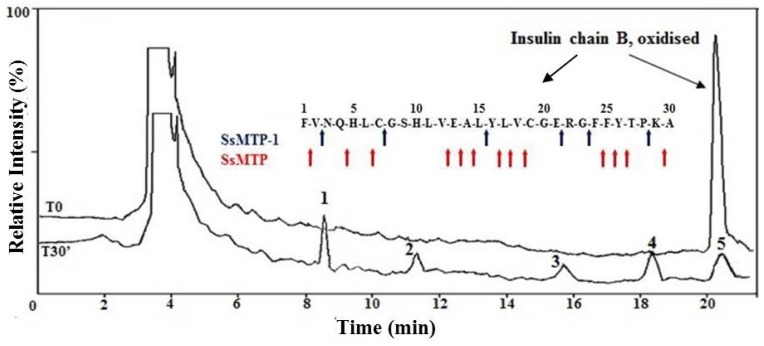
Figure 5.
Cleavage site specificity of SsMTP-1. Overlay of the total ion current chromatograms by high-performance liquid chromatography (HPLC)-electrospray mass spectrometry analysis at time 0 (T0) and 30 min (T30) of SsMTP-1 incubated with the oxidized form of the bovine insulin B chain at 70 °C and pH 2.0. The y-axis represents the relative intensity in percentage measured in counts per second (cps) and normalized to the bovine insulin B chain peak height observed at T0. Cleavage site specificity of SsMTP-1, indicated by arrows on the peptide substrate, was shown in the insert. The data relative to SsMTP were taken from Cannio et al. [7].

