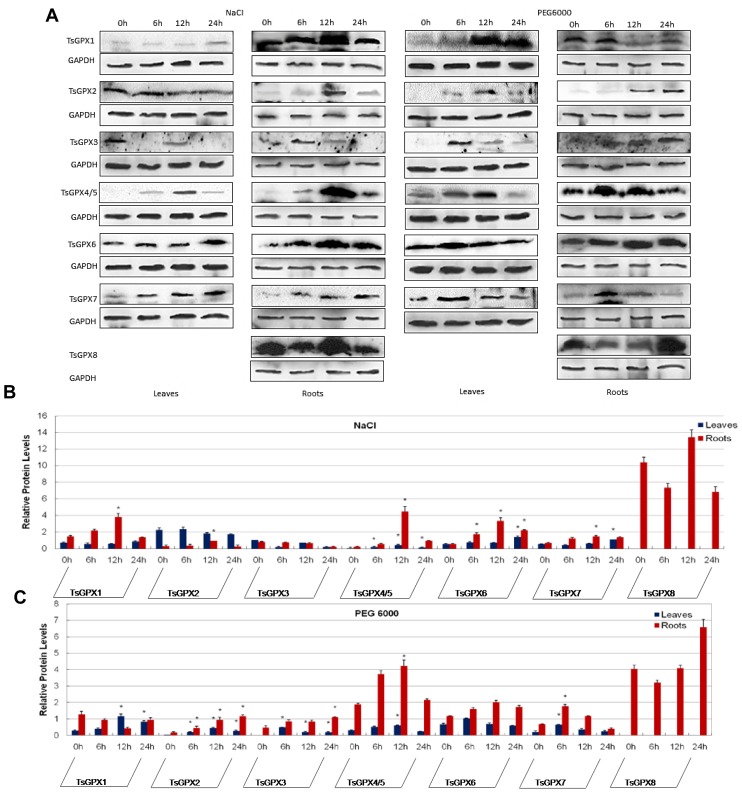
Figure 5.
Western blotting and quantification. (A) Western blotting analysis of Thellungiella salsuginea glutathione peroxidase (TsGPX) in leaves or roots of T. salsuginea before (0) and at 6-, 12-, and 24-h after NaCl or PEG 6000 treatment. Anti-OsGAPDH antibody was used as a control for loading error; (B) Bar graph for the quantitative comparison among TsGPX protein expression levels during NaCl treatment; (C) Bar graph for the quantitative comparison among TsGPX protein expression levels during PEG 6000 treatment. TsGPX- and OsGAPDH-specific bands were quantified by ImageJ software and TsGPX protein expression levels were normalized to GAPDH values. Mean values ± SD of 3 independent experiments are shown. Asterisks denote significant up-regulation (ratio > 2.0) or down-regulation (ratio < 0.5).

