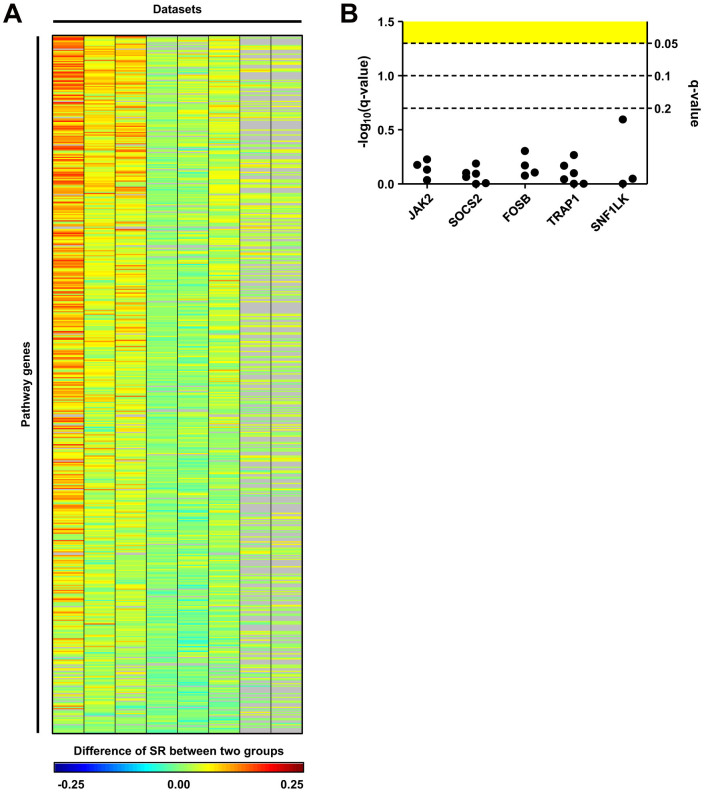
Figure 3. Significant scores of pathway genes over all datasets.
(A) Significance scores of pathway genes over all datasets. Each column represents a dataset and each row represents a pathway gene. Color indicates differences in SR between the two groups (SR of tamoxifen-sensitive patients - SR of tamoxifen-resistant patients) instead of SS for clear visualization. Gray cells indicate the pathway genes that were not available on microarray chips used in the dataset. (B) Significance of expression level differences of the five top-ranked genes. For each gene, a dot indicates the q-value of differential expression in each dataset. For the five top-ranked genes, there were no genes that showed differential expression with FDR < 0.05 (yellow region) in any of datasets.

