
Fig. 1.
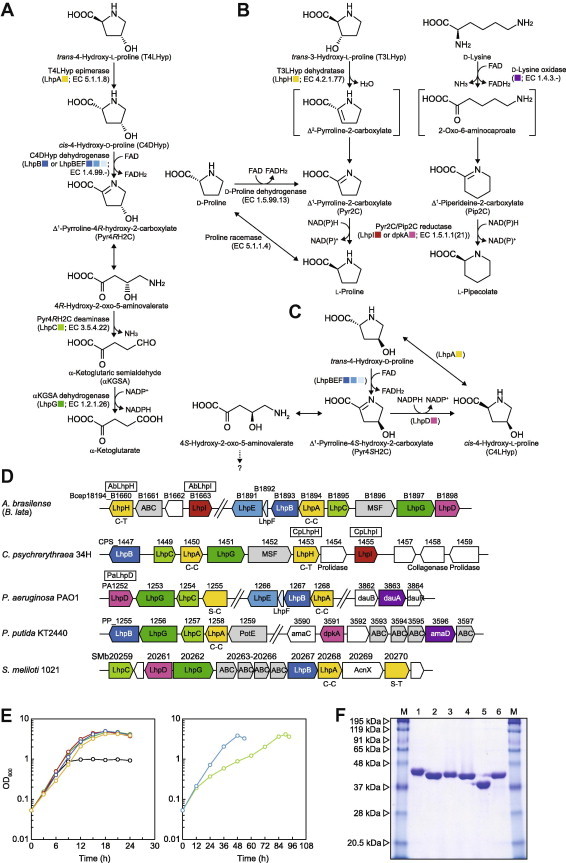
(A) Bacterial pathway of T4LHyp metabolism. Homologous genes are indicated in the same color and correspond to B–D. (B) Novel T3LHyp pathway and the metabolic networks with d-lysine and d-proline. (C) Hypothetical pathway of C4LHyp metabolism. (D) Schematic gene clusters related to T4LHyp and/or T3LHyp metabolism of bacteria. Gene cluster of A. brasilense was assumed from the genome sequence of B. lata (see text). Putative genes in the box were purified and characterized in this study (see F). C-C and C-T indicate a pair of catalytic amino acid residues of proline racemase superfamily enzymes (see Fig. S3A). Gray putative genes are sequentially similar to other amino acid transporters. (E) Growth curves of A. brasilense on glucose (black), l-proline (green), d-proline (light-green), T4LHyp (red), C4DHyp (blue), T3LHyp (yellow) and d-lysine (aqua) as a sole carbon source (30 mM). (F) Purification of recombinant His6 tag proteins. Five micrograms of each of purified protein were applied to 12% (w/v) gel. M: marker proteins. Lane 1, C14orf149; lane 2, AbLhpH; lane 3, CpLhpH; lane 4, PaLhpD; lane 5, AbLhpI; lane 6, CpLhpI. (For interpretation of the references to color in this figure legend, the reader is referred to the web version of this article.)