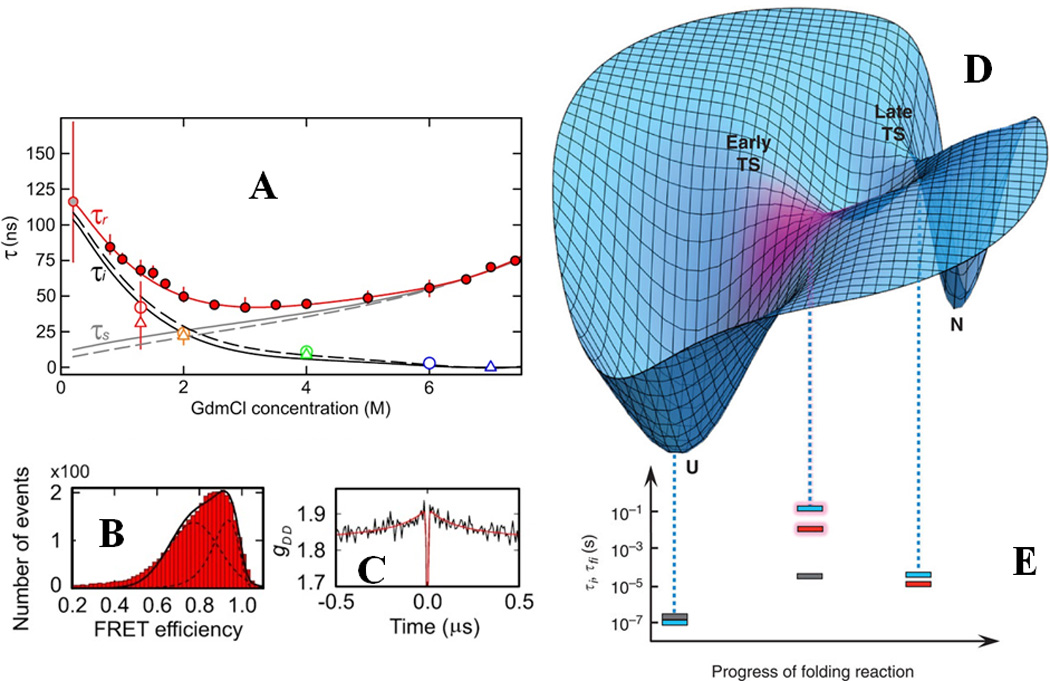
Figure-2.

(A) Quantitative determination of internal friction in the unfolded state of Csp using smFRET (B) and nanosecond FCS (C). The red filled circles in (A) denote experimentally determined reconfiguration time (τr) for end-labeled Csp as a function of guanidinium concentrations under equilibrium conditions, while grey filled circles denote the same observable measured using a microfluidic mixer. The red line is a polynomial fit of the data. τi and τs are the reconfiguration timescales independent and dependent on solvent viscosity, respectively. The symbols represent experimental values for τi and solid and dashed lines are derived from a Rouse model with internal friction. (D) Cartoon depicting the internal friction being localized at the early TS during spectrin folding as shown by magenta. (E) The time constants which are solvent-viscosity independent are indicated by dotted lines as a function of the reaction coordinate: grey for R15 domain, blue for R16 domain and red for R17 domain. The pronounced effect of internal friction on the early TS for R16 and R17 are shown by shaded bars. (A)-(C) are adapted by permission from Soranno et al., Proc. Natl. Acad. Sci. USA (2012) 109:17800 80 (copyright (2012) National Academy of Science, U.S.A.), (D) and (E) are adapted from Borgia et al., Nat. Comm. (2012) 3:1195 by permission from Macmillan Publishers Ltd: [Nature Communication]81, copyright (2012).
