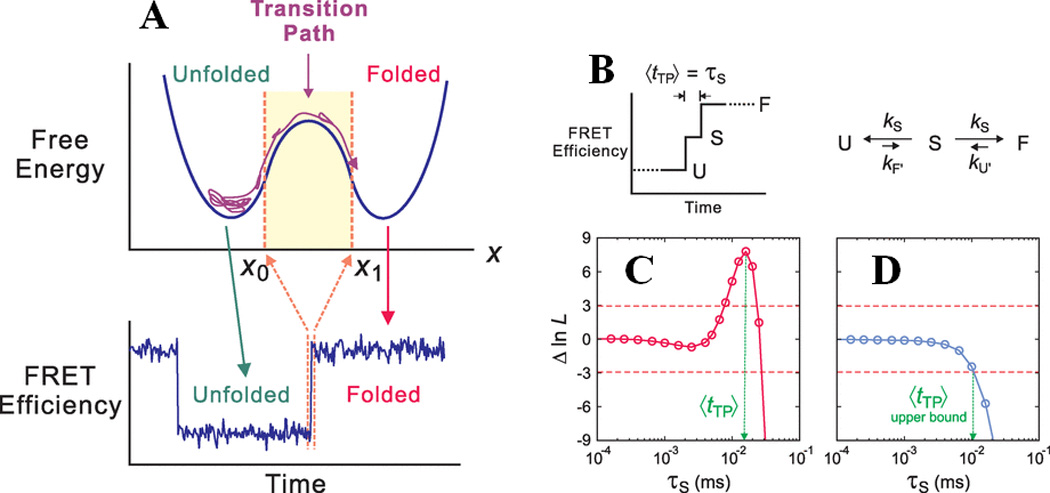
Figure-3.

Determination of the transition path time for protein folding using smFRET. Shown here are (A) a one dimensional free energy diagram highlighting the possible conformational sampling of the unfolded polypeptide chains before it can successfully make a transition from x0 to x1 along the reaction coordinates. This is termed the transition path, and the associated time can be measured by monitoring the FRET transition time from folded to unfolded states, as shown at the bottom. (B) A kinetic model for determining the average transition path time, <tTP>, which is equal to the lifetime (τs) of a “virtual intermediate state”, for a two-state folder. (C) and (D) show plots of the difference of log likelihood between a pathway where τs has a finite value, and a pathway where τs = 0, as a function of τs for WW and GB1, respectively. The positive peak value in WW represents <tTP>, whereas the intersection of the function with the red dashed line at -3 gives the upper bound of <tTP> for GB1. The figure is adapted from Chung et al., Science (2012) 335:981 84 and reprinted with permission from AAAS.
