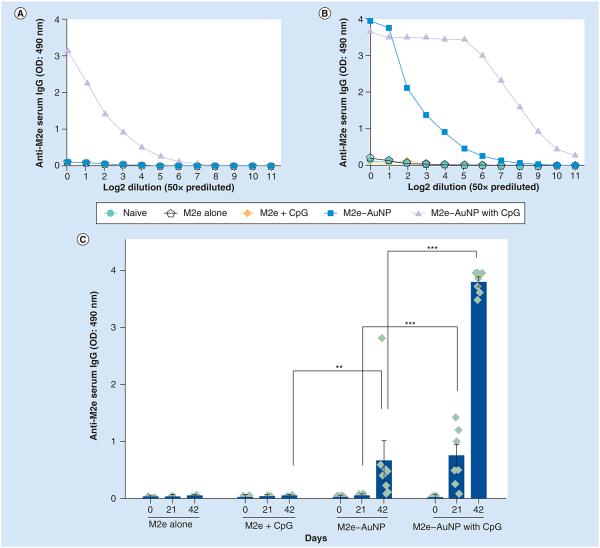
Figure 4. M2e-specific IgG antibody response in mouse serum.
(A) Titration curve for pooled day 21 serum. (B) Titration curve for pooled day 42 serum. (C) M2e-specific IgG antibodies in 1:200 diluted serum of individual mice of a group. OD measured at 490 nm wavelength. Each diamond in (C) represents an animal in a group (n = 3 in M2e alone group, n = 5 in M2e + CpG group and n = 8 for the remainder of the groups), the vertical column represents the mean, and error bars represent standard error of the mean. The data presented combine results of two independent experiments.
**p < 0.01; ***p < 0.001.
AuNP: Gold nanoparticle; OD: Optical density.

