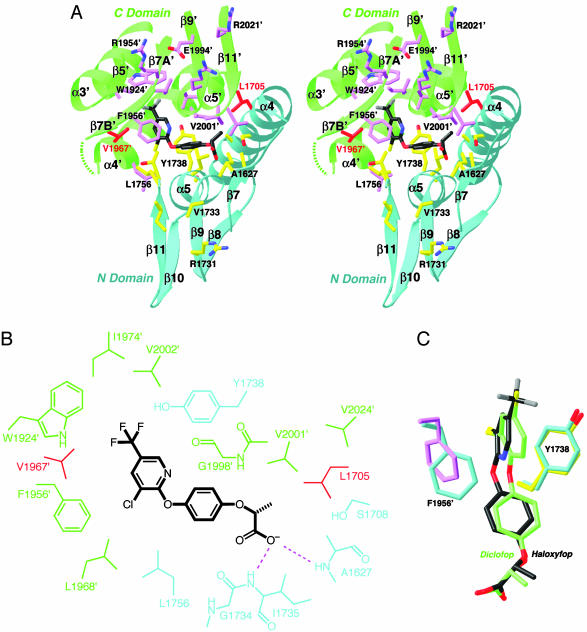
Fig. 2.
The binding mode of haloxyfop. (A) Stereographic drawing showing the binding site for haloxyfop. The N domain of one monomer is colored in cyan, and the C domain of the other monomer is in green. The side chains of residues in the binding site are shown in yellow and magenta, respectively. The dashed segment indicates the disordered residues 1959′–1964′. The drawing was produced with ribbons (29). (B) Schematic drawing of the interactions between haloxyfop and the CT domain. (C) Overlay of the binding mode of haloxyfop (in black) and diclofop (in green). The conformations of residues Tyr-1738 and Phe-1956′ in the haloxyfop (yellow and magenta) and diclofop (cyan) complexes are also shown.

