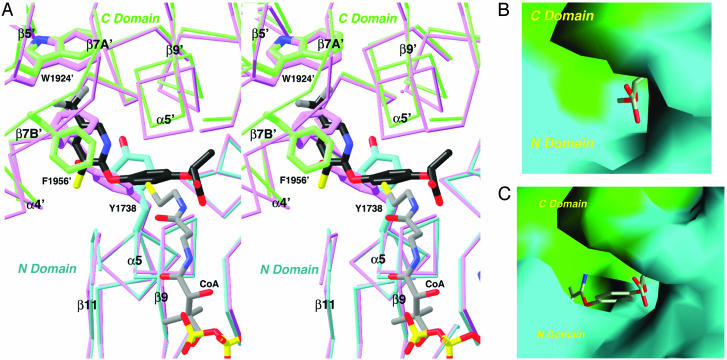
Fig. 3.
Conformational change in the CT domain upon inhibitor binding. (A) Stereographic structural overlay of the CT domain free enzyme (in magenta) and the haloxyfop complex (in cyan and green for the N and C domains) near the inhibitor binding site. The binding mode of CoA (11) is also shown. The poorer structural overlap in the C domain is due to the change in the dimer organization. (B) Molecular surface of the active site of the free enzyme. The model of haloxyfop is included for reference. Most of the inhibitor is in steric clash with the enzyme. (C) Molecular surface of the binding site in the haloxyfop complex. For both B and C, residues 1759–1772 and 2026′–2098′ have been removed to give a better view of the binding site. A was produced with ribbons (29), and B and C were produced with grasp (30).

