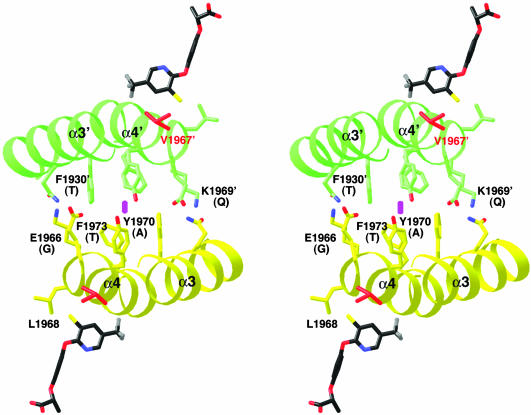
Fig. 5.
Differences between yeast and plant ACCs in the dimer interface of the CT domain. In this stereographic drawing, the α3 and α4 helices of one monomer are shown in yellow, and those of the other monomer are shown in green. The side chains in the dimer interface are shown and labeled. The equivalent residues in the plant ACCs are shown in parentheses. The haloxyfop molecules are shown for reference. The twofold axis of the dimer is indicated by the magenta oval.

