
Table 2. Three-protein network motifs in the stringent network.
| No. of occurrences
|
||||||||
|---|---|---|---|---|---|---|---|---|
| Stringent network
|
Nonstringent network
|
Comments regarding occurrences in the stringent network | ||||||
| Motif* | Illustration† | N real | N rand ± SD | z score | N real | N rand ± SD | Z score | |
| A. Protein clique | 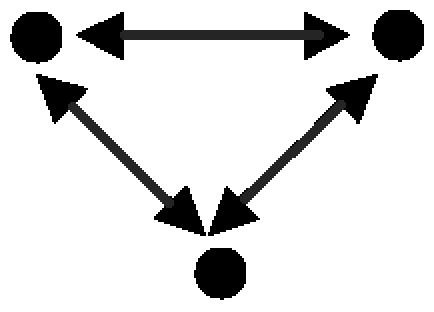 |
1,293 | 14 ± 3.8 | 332.7 | 2,016 | 87 ± 10.8 | 177.9 | 1,198 occurrences in experimentally identified complexes |
| B. Interacting transcription factors that coregulate a third gene | 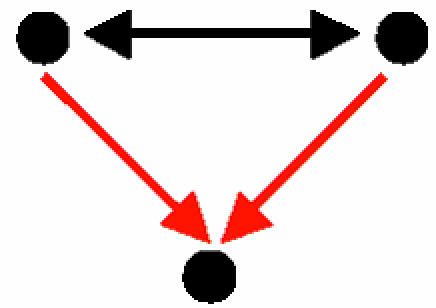 |
243 | 2.4 ± 2.1 | 115.9 | 476 | 9.6 ± 7.8 | 59.7 | 21 pairs of coregulating proteins, most of which act in concert |
| C. Feed-forward loop | 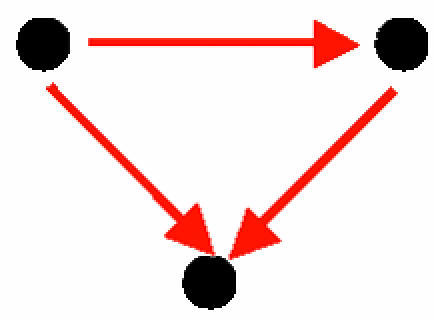 |
83 | 26 ± 6 | 9.5 | 994 | 473 ± 36.7 | 14.2 | Analyzed in refs. 11, 40, and 41 |
| D. Coregulated interacting proteins | 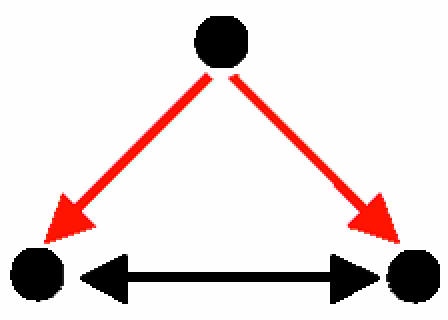 |
66 | 2 ± 1.4 | 46.5 | 285 | 107 ± 10.1 | 17.7 | 25 sets of coregulated interacting proteins, most of which act in concert or participate in a common complex |
| E. Mixed-feedback loop between transcription factors that coregulate a gene | 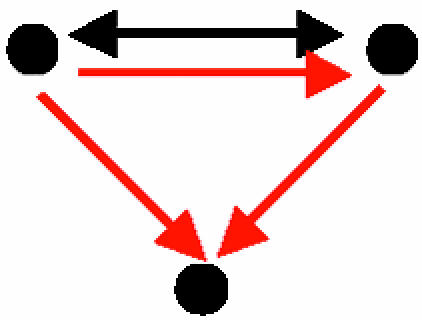 |
46 | 2.7 ± 1.6 | 26.3 | 118 | 8.2 ± 5.4 | 20.3 | Four distinct pairs of transcription factors that are also involved in a mixed-feedback loop |
*
These motifs were highly statistically significant in both the stringent and nonstringent networks; in all 1,000 randomized networks the number of their occurrences was lower than in the actual network.
†
A node represents a gene and its protein product; a red, directed edge represents a TRI; a black, bidirected edge represents a PPI.