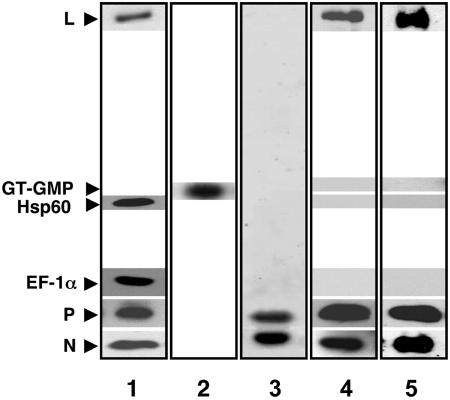
Fig. 3.
Purification and characterization of replicase. Western blot analysis of anti-EF-1α flow-through fraction (40 μg) (lane 1), anti-P eluate fraction (500 ng) (lane 4), and anti-N eluate fraction (500 ng) (lane 5) was carried out by SDS/PAGE followed by immunoblot analysis with L, EF-1α, P, and N and Hsp60 specific antibodies. The bands were visualized by enhanced chemiluminescence. A GT–GMP assay (lane 2) was carried out (500 ng) as described in Fig. 1. Anti-P eluate (4 μg) was subjected to SDS/PAGE and visualized by staining with Coomassie blue dye (lane 3).

