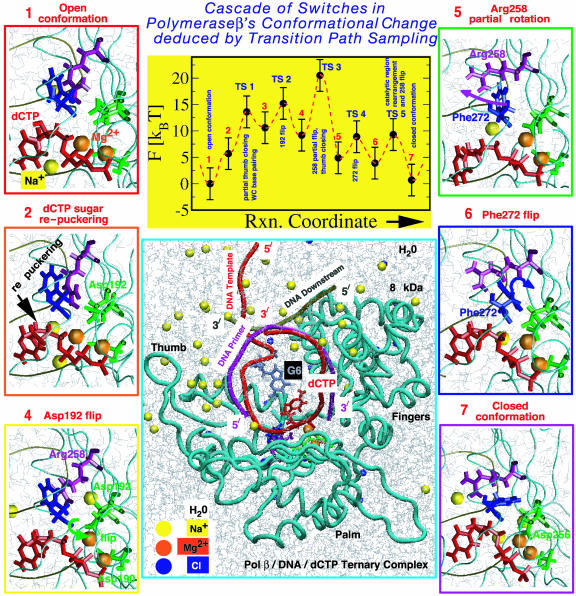
Fig. 4.
(Upper Center) Overall captured reaction kinetics profile from TPS for pol β's closing transition (for a G·C system) from the open state and estimated energies in units of kBT (product of Boltzmann constant and absolute temperature). Different barrier regions (TS) and metastable basins along the reaction coordinate are illustrated (images 1, 2, 4–6, and 7). (Lower Center) Structure of pol β/DNA/dCTP ternary complex.

