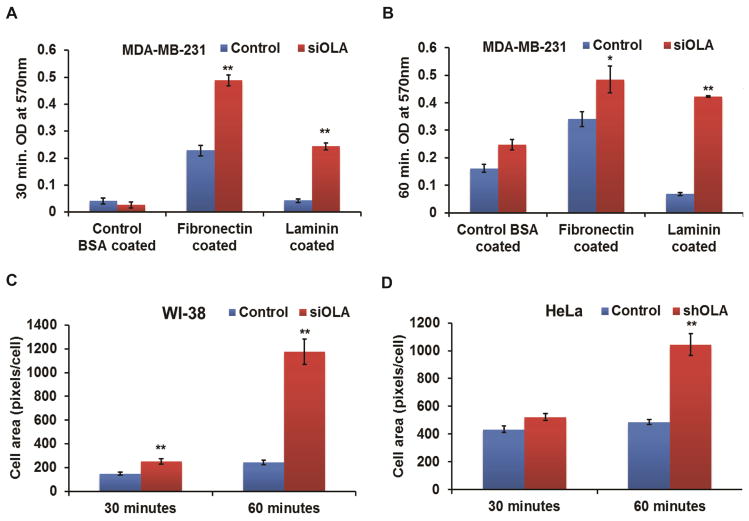
Figure 2. Quantitative analysis of cell adhesion and spreading.
MDA-MB-231 cells transiently transfected with the control and OLA siRNA (siOLA) were analyzed for adhesion rate on BSA-, fibronectin-, or laminin-coated plates. Attached cells were fixed at 30 minutes (A) and 60 minutes (B) after plating, and quantified by crystal violet staining. Data represent mean ± SEM values from 3 independent experiments. *, p < 0.05; **, p < 0.001. Spreading of the control-transfected and OLA1-knockdown WI-38 (C) and HeLa (D) cells were quantified using ImageJ software based on images of cell adhesion taken at 30 and 60 minutes. Data represent the mean ± SEM of cell area, expressed as pixels per cell, of cells pooled from 5 different microscopic fields for each group. **, p < 0.001 (n = 25).

