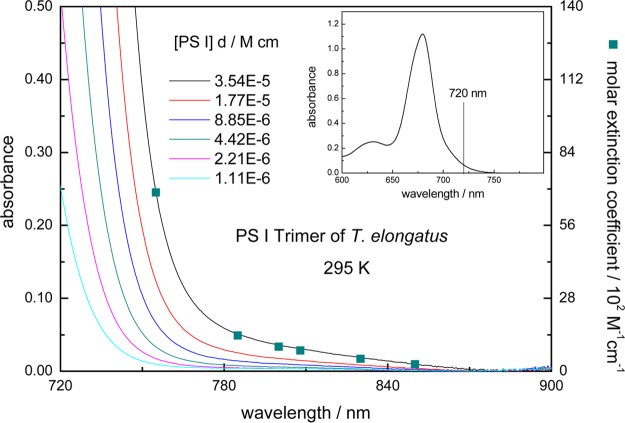
Figure 5.
Room temperature absorbance spectra of highly concentrated PS I trimer samples from T. elongatus in the far-red wavelength range between 720 and 900 nm. The squares represent the ε-values (see right scale) for the different excitation wavelengths used in this work. The inset shows the absorbance spectrum in the QY region with [PS I]·d = 2.0 × 10⁻⁷ M cm.

