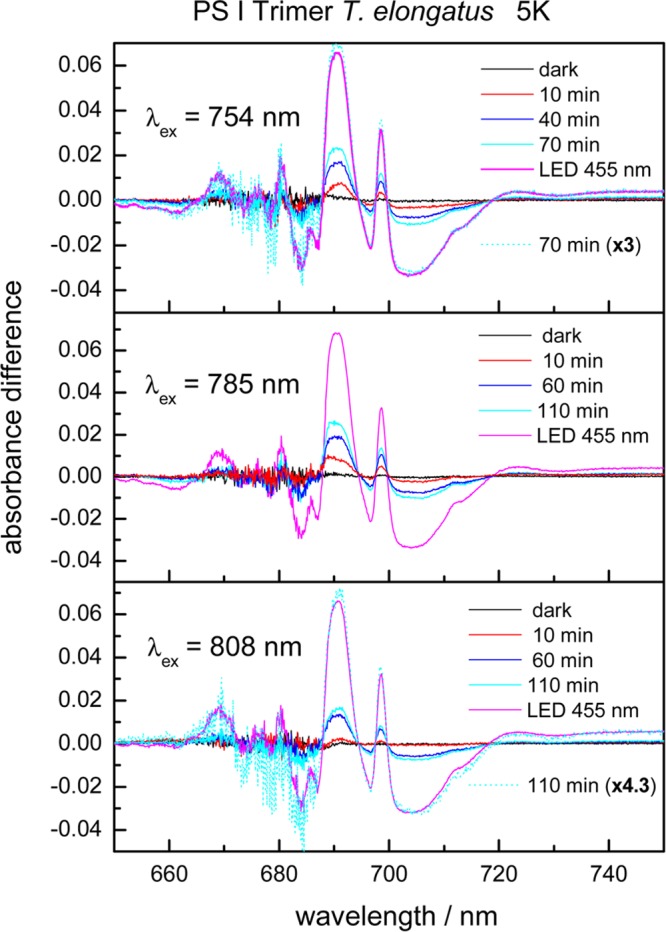
Figure 9.

Light-minus-dark absorbance difference spectra of PS I trimers of T. elongatus at 5 K measured after selective excitation at 754 nm, 785 or 808 nm and different illumination periods. The difference spectra were obtained by subtracting the absorbance spectra in the dark-adapted state from those measured after selective excitation. The curves denoted “dark” show the difference between two absorbance spectra of the dark-adapted sample measured directly one after the other. The curve denoted “LED 455 nm” is the difference between the absorbance spectra in the dark-adapted state and those measured after illumination by 455 nm LED light.
