
Figure 8. SCF and Myocyte Regeneration.

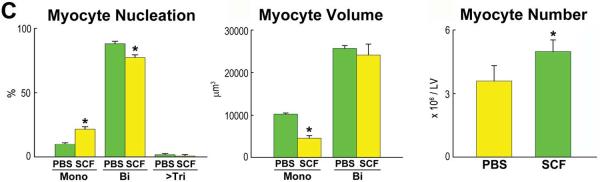

A: Mice 26–30 month-old: BrdU labeling (yellow) in cardiomyocytes (α-SA, red) of control (PBS) and SCF-treated hearts. Data are shown as mean±SD. PBS, green bars; SCF, yellow bars. *P<0.05 vs. PBS. B: CSCs per mm3 of myocardium. *P<0.05 vs. PBS. C: Proportion, volume and number of mononucleated and binucleated myocytes in the LV of control (PBS) and SCF-treated hearts. *P<0.05 vs. PBS. D: Telomere length measured by Q-FISH in BrdU-positive (yellow nuclei; arrows) and negative (DAPI, blue) myocytes. Distribution and average values of telomeres in BrdU-positive and BrdU-negative myocytes in mice injected with PBS or SCF. *,**P<0.05 vs. BrdU-negative myocytes and vs. BrdU-positive myocytes treated with PBS, respectively.