
Figure 3.

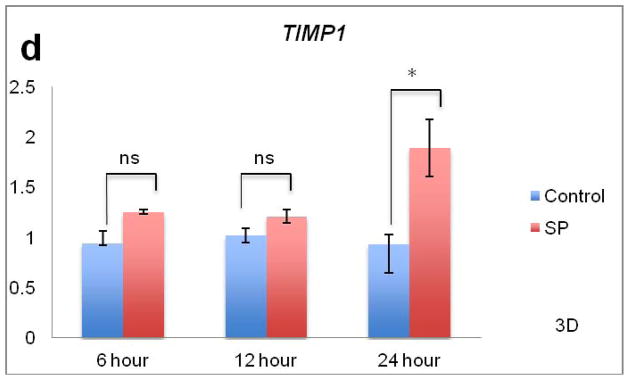
Effects of SP on collagen remodeling and mRNA levels. Figure 3A. For ACTA2, expression increased in both control and SP treated tenocytes (p<0.01, two-way ANOVA) while SP further increased ACTA2 expression compared to control (p<0.05, two-way ANOVA). There was an interaction between time and treatment. At the 6 hour time point, SP significantly upregulated ACTA2 compared to control (*p<0.05, independent samples t-test). Figure 3B. There was an increase in MMP3 expression due to SP treatment (p<0.001, two-way ANOVA). There was no interaction between time and treatment. SP led to significant upregulation of MMP3 at 6 and 12 hours compared to the control (*p<0.05 and **p<0.01, independent samples t-test respectively). Figure 3C. For COL3A1, expression increased in both control and SP treated tenocytes (p<0.05, two-way ANOVA). There was an interaction between time and treatment. At the 6 hour time point, SP significantly upregulated COL3A1 compared to the control (**p<0.01, independent samples t-test). Figure 3D. There was an increase in TIMP1 expression due to SP treatment (p<0.001, two-way ANOVA). There was an interaction between time and treatment. SP led to significant upregulation of TIMP1 at the 24 hour time point (*p<0.05, independent samples t-test).