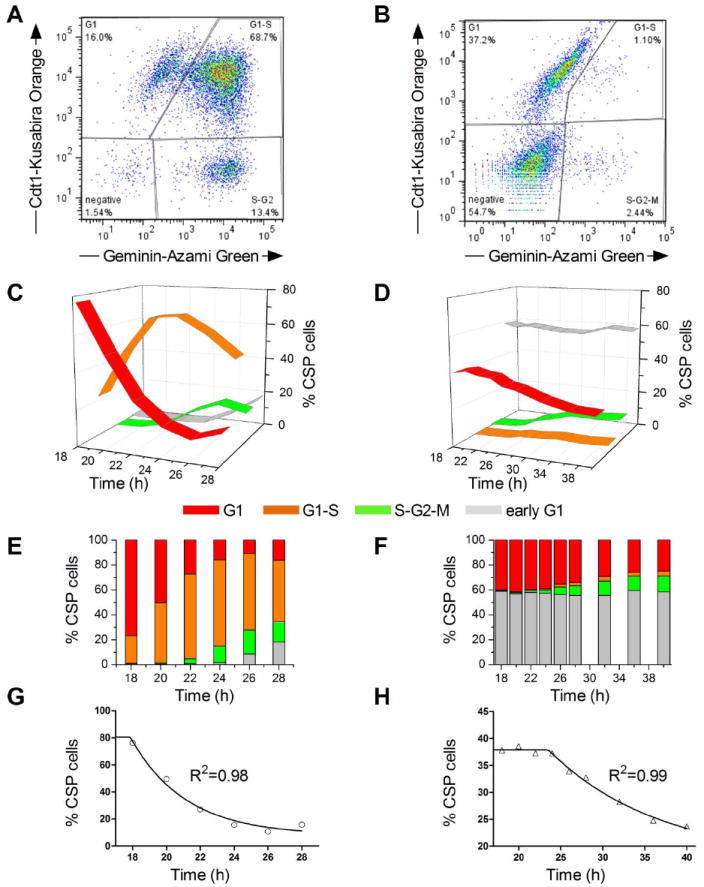
Figure 2. Lack of Abcg2 prolongs cell cycle duration in CSP cells.


Representative flow cytometric analysis of Fucci+ (A) WT and (B) Abcg2-KO CSP cells 24 hours post-synchronization. Time course analysis of Fucci+ (C) WT and (D) Abcg2-KO CSP cells over a period of 10 and 22 hours respectively, starting at 18 hours post-synchronization. Bar graphs indicate the percentage of (E) WT and (F) Abcg2-KO CSP cells residing in each cell cycle phase during the specified time course. (G-H) Mathematical calculation of the G1-phase T50 value following a “plateau followed by exponential decay” model. The T50 for (G) WT and (H) Abcg2-KO CSP cells is 20.2hr and 32.6hr respectively. (I-J) Sequential (2 hours interval) DIC and fluorescent confocal microscopy images of Fucci+ (I) WT and (J) Abcg2-KO CSP cells 18-40 hours following synchronization. Cells were infected with lentiviruses expressing both Cdt1-Kusabira Orange probe (red) and Geminin-Azami Green (green) present in the G1 and the S-G2-M phases respectively. Cells residing in the G1-S transition phase appear as orange. Cells immediately after cytokinesis or in early G1 phase lose the fluorescence. Scale bars 20μm. Yellow box indicates the position of representative (I) WT and (J) Abcg2-KO CSP cells.
