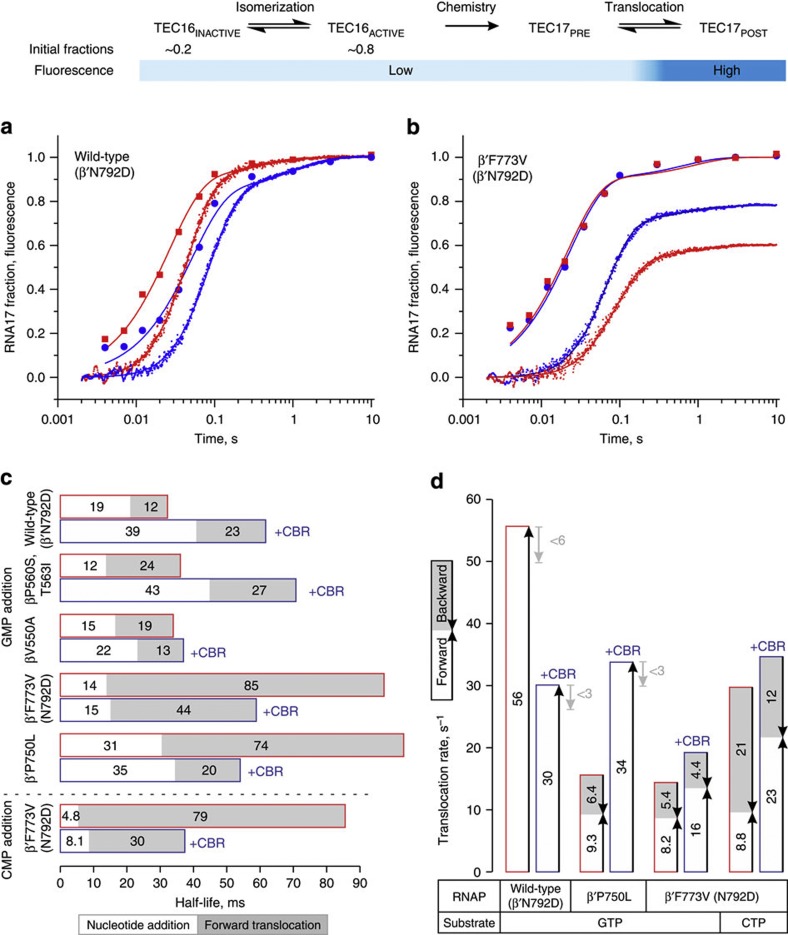
Figure 3. Effects of CBR703 and substitutions at the BH-β subunit interface on nucleotide addition and translocation rates.
Top schematic describes the experimental set-up. CBR703 is present at 100 μM where indicated (blue outline). Best fit curves and bar graphs were drawn using parameters described in Supplementary Table 5. (a,b) Time courses of GMP addition (discrete time points) and translocation (continuous trace) by wild-type (a) and β′F773V (b) RNAPs. Nucleotide addition and translocation assays were performed in duplicate; translocation curves are averages from six to nine time traces. (c) Half-lives of nucleotide addition cycles calculated as sums of nucleotide addition (white fill) and forward translocation (grey fill) half-lives. (d) The apparent translocation rates of wild-type (β′N792D), β′P750L and β′F773V, β′N792D RNAPs depicted as sums of forward (white fill) and backward (grey fill) translocation rates. The representation reflects the relationship between the above three rates defined by formal kinetic rules for a reversible reaction. For wild-type RNAP and β′P750L (in the presence of CBR703), the backward rates are constrained to zero during the fit but may potentially constitute up to 10% of forward rate (grey arrows) assuming 10% uncertainty in determination of fluorescent levels of extended TECs.

