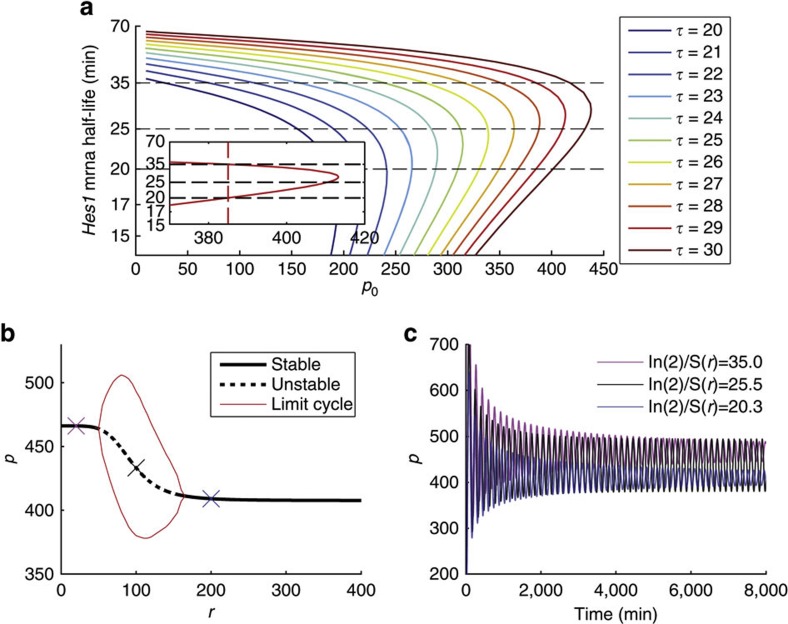
Figure 2. Presence of oscillations in the model when miR-9 acts only to affect the stability of Hes1 mRNA.
(a) Different combinations of τ, p0 and S(r) are used to test for the presence of oscillations. The different coloured lines denote Hopf bifurcations for different values of τ as indicated. A Hopf bifurcation denotes the transition of a system from a stable to an unstable, oscillatory state or vice versa, as a parameter of the system is varied. Fixed points exist to the right of the curves whereas oscillations are present to the left. The inset shows the curve for τ=29. The dashed red line indicates the value of p0 for which two Hopf bifurcations exist for mRNA half-lives of ~35 and 20 min. (b) A window of oscillations emerges for changes in r, with p0 fixed at 390 and τ=29 min. (c) Example time series when r is fixed to the values given by crosses in (b). These r values give rise to the half-lives (ln(2)/S(r)) as indicated. n0=5, μp=22 min, bl=ln(2)/20 min−1, bu=ln(2)/35 min−1, r0=100, m0=5.

