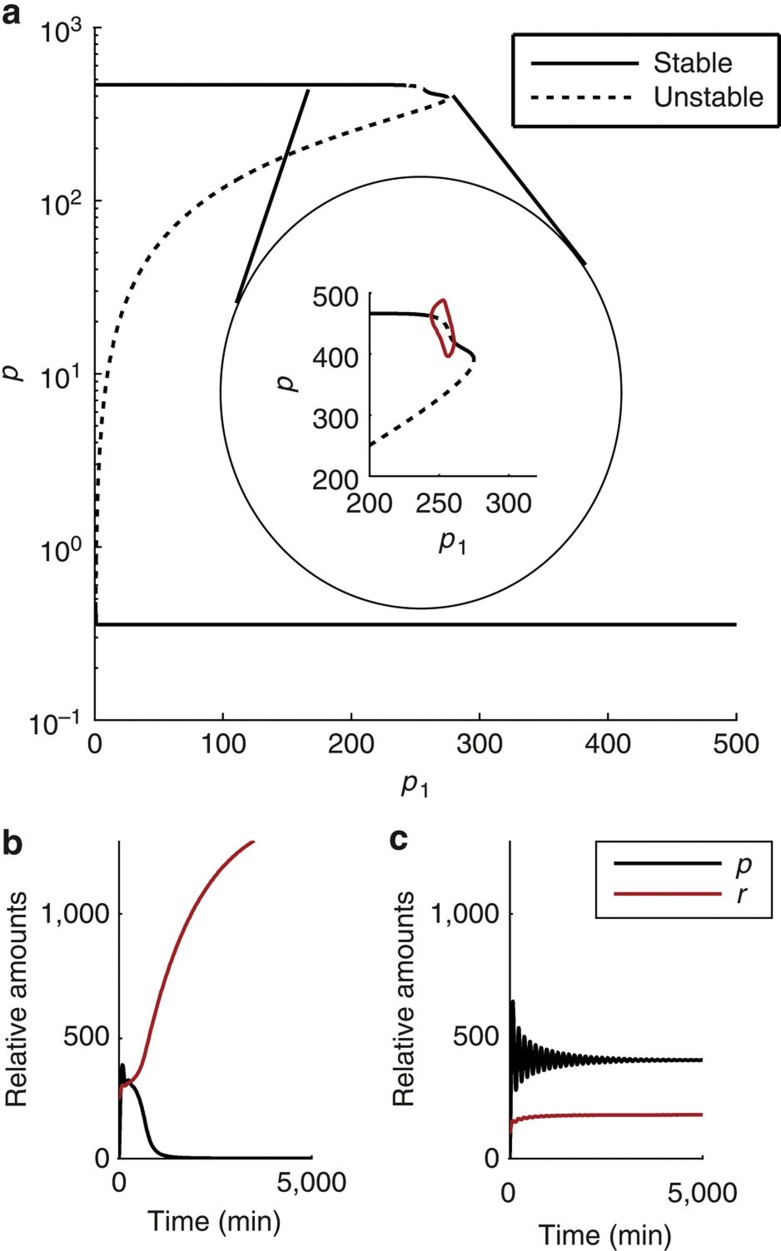
Figure 4. Oscillations and different steady-state levels of Hes1 in the full system for changes in the strength of repression of miR-9 by Hes1 (p1).
(a) Shows a bifurcation diagram for changes in p1, with protein levels (p) given as output on the y axis. The circled area shows a magnified region of parameter space that contains oscillations (limit cycle maxima and minima given by red lines). (b,c) Show example of time series for a case of bistability (p1=272). The initial conditions (giving a constant history vector) are (b) m(0)=0, p(0)=0, r(0)=240 and (c) m(0)=0, p(0)=0, r(0)=100. Other parameters are p0=390, τ=29 min, bl=ln(2)/20 min−1, bu=ln(2)/35 min−1, n0=n1=m0=m1=5, r0=100, r1=300, μp=22 min, μr=1,000 min.

