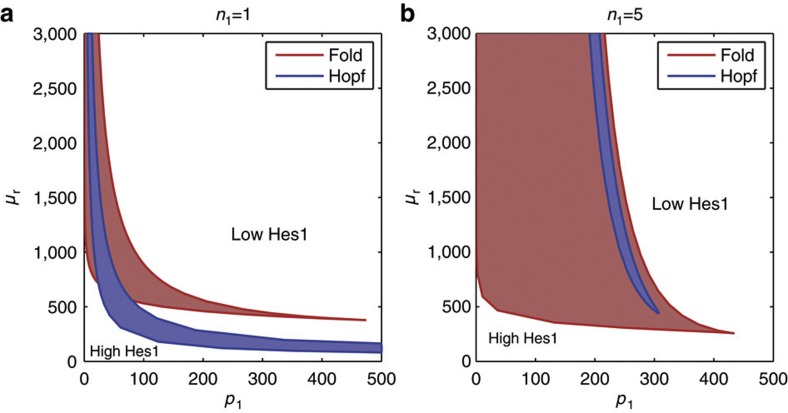
Figure 7. The model can display bistability, sustained oscillations, stable high or low levels of Hes1 depending upon its parameterization.
Local bifurcations are shown for changes in the miR-9 degradation rate, μr, the strength of repression of miR-9 production by Hes1, p1 and the shape of repression of miR-9 production by Hes1, n1. The presence of Hopf and fold bifurcations are indicated by blue and red solid lines, respectively. Fold bifurcations lead to the creation or elimination of a pair of fixed points. Blue regions, therefore, indicate the presence of oscillations, while red regions indicate bistability. White regions represent the case of a single steady state with either high or low Hes1 levels (as indicated by the annotation). (a) n1=1. (b) n1=5. Other parameters are p0=390, τ=29 min, bl=ln(2)/20 min−1, bu=ln(2)/35 min−1, n0=m0=m1=5, r0=100, r1=300, μp=22 min.

